P5YP3YP5YP3YP4M1010P6Y10M15DP25YP6MP1YP1Y22P42DP3MP6YP6M3P1YP3Yfalse--11-30FY20172017-11-3010-K00007214479677026488982YesSmaller Reporting Company15711168CCA INDUSTRIES INCNoNoCAW13923805403610.010.010.010.0150000001500000050000001500000096770260389829677026038982967702603898296770260389820.06P3Y000P5Y4MP3Y11200000002000000000P10YP3YP7YP5YP3Y00P12M1000000
0000721447
2016-12-01
2017-11-30
0000721447
2017-05-31
0000721447
us-gaap:CommonClassAMember
2018-02-15
0000721447
us-gaap:CommonStockMember
2018-02-15
0000721447
2016-11-30
0000721447
2017-11-30
0000721447
us-gaap:CommonStockMember
2016-11-30
0000721447
us-gaap:CommonClassAMember
2016-11-30
0000721447
us-gaap:CommonClassAMember
2017-11-30
0000721447
us-gaap:CommonStockMember
2017-11-30
0000721447
2014-12-01
2015-11-30
0000721447
2015-12-01
2016-11-30
0000721447
us-gaap:RetainedEarningsMember
2016-12-01
2017-11-30
0000721447
us-gaap:RetainedEarningsMember
2015-11-30
0000721447
us-gaap:CommonStockMember
2017-11-30
0000721447
us-gaap:RetainedEarningsMember
2015-12-01
2016-11-30
0000721447
us-gaap:AdditionalPaidInCapitalMember
2017-11-30
0000721447
us-gaap:CommonStockMember
2014-11-30
0000721447
us-gaap:AdditionalPaidInCapitalMember
2015-11-30
0000721447
us-gaap:AdditionalPaidInCapitalMember
2014-11-30
0000721447
us-gaap:CommonStockMember
2016-11-30
0000721447
2015-11-30
0000721447
us-gaap:CommonStockMember
2015-11-30
0000721447
2014-11-30
0000721447
us-gaap:RetainedEarningsMember
2017-11-30
0000721447
us-gaap:AdditionalPaidInCapitalMember
2016-11-30
0000721447
us-gaap:AdditionalPaidInCapitalMember
2016-12-01
2017-11-30
0000721447
us-gaap:AdditionalPaidInCapitalMember
2015-12-01
2016-11-30
0000721447
us-gaap:RetainedEarningsMember
2014-12-01
2015-11-30
0000721447
us-gaap:RetainedEarningsMember
2014-11-30
0000721447
us-gaap:RetainedEarningsMember
2016-11-30
0000721447
us-gaap:AdditionalPaidInCapitalMember
2014-12-01
2015-11-30
0000721447
us-gaap:PatentsMember
2016-12-01
2017-11-30
0000721447
us-gaap:TrademarksMember
2016-12-01
2017-11-30
0000721447
us-gaap:TrademarksMember
2015-12-01
2016-11-30
0000721447
us-gaap:FurnitureAndFixturesMember
us-gaap:MinimumMember
2016-12-01
2017-11-30
0000721447
us-gaap:FurnitureAndFixturesMember
us-gaap:MaximumMember
2016-12-01
2017-11-30
0000721447
us-gaap:MachineryAndEquipmentMember
us-gaap:MaximumMember
2016-12-01
2017-11-30
0000721447
us-gaap:MachineryAndEquipmentMember
us-gaap:MinimumMember
2016-12-01
2017-11-30
0000721447
us-gaap:ToolsDiesAndMoldsMember
2016-12-01
2017-11-30
0000721447
us-gaap:CapitalLeaseObligationsMember
2016-11-30
0000721447
us-gaap:ToolsDiesAndMoldsMember
2017-11-30
0000721447
caw:FurnitureAndEquipmentMember
2017-11-30
0000721447
caw:FurnitureAndEquipmentMember
2016-11-30
0000721447
us-gaap:CapitalLeaseObligationsMember
2017-11-30
0000721447
us-gaap:LeaseholdsAndLeaseholdImprovementsMember
2016-11-30
0000721447
us-gaap:LeaseholdsAndLeaseholdImprovementsMember
2017-11-30
0000721447
us-gaap:ToolsDiesAndMoldsMember
2016-11-30
0000721447
us-gaap:RevolvingCreditFacilityMember
2015-12-04
0000721447
us-gaap:AdditionalPaidInCapitalMember
caw:CapitalPreservationSolutionsLLCMember
2014-09-05
0000721447
caw:CapitalPreservationSolutionsLLCMember
2014-09-05
0000721447
caw:CapitalPreservationSolutionsLLCMember
us-gaap:CommonStockMember
2014-09-05
0000721447
us-gaap:LineOfCreditMember
2015-12-04
0000721447
us-gaap:LineOfCreditMember
caw:CapitalPreservationSolutionsLLCMember
2014-09-05
0000721447
us-gaap:RevolvingCreditFacilityMember
us-gaap:LondonInterbankOfferedRateLIBORMember
2015-12-04
2015-12-04
0000721447
us-gaap:RevolvingCreditFacilityMember
2015-12-04
2015-12-04
0000721447
caw:DebtDiscountMember
caw:CapitalPreservationSolutionsLLCMember
2014-09-05
0000721447
us-gaap:LineOfCreditMember
2015-12-04
2015-12-04
0000721447
us-gaap:RevolvingCreditFacilityMember
2017-11-30
0000721447
us-gaap:LoansPayableMember
caw:CapitalPreservationSolutionsLLCMember
2014-09-05
0000721447
caw:DeferredFinancingFeesMember
caw:CapitalPreservationSolutionsLLCMember
2014-09-05
0000721447
caw:CapitalPreservationSolutionsLLCMember
2014-09-05
2014-09-05
0000721447
us-gaap:SegmentDiscontinuedOperationsMember
2016-12-01
2017-11-30
0000721447
us-gaap:SegmentDiscontinuedOperationsMember
2015-12-01
2016-11-30
0000721447
us-gaap:SegmentDiscontinuedOperationsMember
2014-12-01
2015-11-30
0000721447
us-gaap:DomesticCountryMember
2017-11-30
0000721447
us-gaap:StateAndLocalJurisdictionMember
2017-11-30
0000721447
us-gaap:DomesticCountryMember
2016-11-30
0000721447
us-gaap:StateAndLocalJurisdictionMember
2016-11-30
0000721447
us-gaap:DomesticCountryMember
2015-11-30
0000721447
us-gaap:StateAndLocalJurisdictionMember
2015-11-30
0000721447
us-gaap:SegmentContinuingOperationsMember
2014-12-01
2015-11-30
0000721447
us-gaap:SegmentContinuingOperationsMember
2015-12-01
2016-11-30
0000721447
us-gaap:SegmentContinuingOperationsMember
2016-12-01
2017-11-30
0000721447
caw:CharitableContributionsMember
2017-11-30
0000721447
us-gaap:WarehouseMember
us-gaap:SubsequentEventMember
2017-12-01
2017-12-31
0000721447
us-gaap:WarehouseMember
2015-06-01
2015-06-30
0000721447
caw:ContinentalQuestCorpMember
2016-12-01
2017-11-30
0000721447
caw:UltimarkProductsIncMember
2017-03-23
2017-03-23
0000721447
caw:SolarSenseMember
2016-12-01
2017-11-30
0000721447
caw:AlleghanyPharmacalCorporationMember
2016-12-01
2017-11-30
0000721447
us-gaap:SubsequentEventMember
caw:DouglasHaasMember
2017-12-31
0000721447
us-gaap:SubsequentEventMember
caw:Mr.HeitMember
2017-12-31
2017-12-31
0000721447
us-gaap:WarehouseMember
2015-04-01
2015-04-30
0000721447
caw:SolarSenseMember
1998-05-01
2017-11-30
0000721447
caw:Mr.HeitMember
2014-10-01
2014-10-31
0000721447
us-gaap:OfficeBuildingMember
2015-04-01
2015-04-30
0000721447
caw:Mr.HeitMember
2012-12-01
2013-11-30
0000721447
us-gaap:WarehouseMember
us-gaap:ScenarioForecastMember
2017-12-01
2018-02-28
0000721447
caw:UltimarkProductsIncMember
2017-03-23
0000721447
caw:UltimarkProductsIncMember
2017-11-30
0000721447
us-gaap:WarehouseMember
2014-12-01
2015-11-30
0000721447
caw:DouglasHaasMember
2017-02-22
0000721447
caw:ContinentalQuestCorpMember
1998-05-01
2017-11-30
0000721447
caw:DouglasHaasMember
2016-12-01
2017-11-30
0000721447
us-gaap:SubsequentEventMember
2017-12-01
2017-12-31
0000721447
caw:OralCareMember
2015-12-01
2016-11-30
0000721447
caw:SkinCareMember
2014-12-01
2015-11-30
0000721447
caw:SkinCareMember
2015-12-01
2016-11-30
0000721447
caw:OralCareMember
2016-12-01
2017-11-30
0000721447
caw:SkinCareMember
2016-12-01
2017-11-30
0000721447
caw:OralCareMember
2014-12-01
2015-11-30
0000721447
caw:CVSMember
2014-12-01
2015-11-30
0000721447
caw:ForeignSalesMember
2015-12-01
2016-11-30
0000721447
caw:WalgreenMember
2016-12-01
2017-11-30
0000721447
caw:WalmartMember
2016-12-01
2017-11-30
0000721447
caw:TargetMember
2014-12-01
2015-11-30
0000721447
caw:WalmartMember
2014-12-01
2015-11-30
0000721447
caw:WalgreenMember
2014-12-01
2015-11-30
0000721447
caw:WalgreenMember
2015-12-01
2016-11-30
0000721447
caw:WalmartMember
2015-12-01
2016-11-30
0000721447
caw:TargetMember
2015-12-01
2016-11-30
0000721447
caw:TargetMember
2016-12-01
2017-11-30
0000721447
caw:ForeignSalesMember
2016-12-01
2017-11-30
0000721447
caw:ForeignSalesMember
2014-12-01
2015-11-30
0000721447
caw:A2014RestructuringPlanMember
2014-11-30
0000721447
caw:RealEstateCommissionMember
caw:A2014RestructuringPlanMember
2014-12-01
2015-11-30
0000721447
caw:A2014RestructuringPlanMember
2015-12-01
2016-11-30
0000721447
caw:FairValueofRentLossMember
caw:A2014RestructuringPlanMember
2014-12-01
2015-11-30
0000721447
caw:AssetImpairmentMember
caw:A2014RestructuringPlanMember
2014-12-01
2015-11-30
0000721447
caw:A2014RestructuringPlanMember
2015-11-30
0000721447
us-gaap:FacilityClosingMember
caw:A2014RestructuringPlanMember
2014-12-01
2015-11-30
0000721447
caw:A2014RestructuringPlanMember
2016-11-30
0000721447
caw:A2014RestructuringPlanMember
2016-12-01
2017-11-30
0000721447
us-gaap:DiscontinuedOperationsDisposedOfByMeansOtherThanSaleMember
caw:GelPerfectMember
us-gaap:SegmentDiscontinuedOperationsMember
2014-11-30
0000721447
us-gaap:DiscontinuedOperationsDisposedOfByMeansOtherThanSaleMember
caw:GelPerfectMember
us-gaap:SegmentDiscontinuedOperationsMember
2014-12-01
2015-11-30
0000721447
us-gaap:DiscontinuedOperationsDisposedOfByMeansOtherThanSaleMember
caw:GelPerfectMember
us-gaap:SegmentDiscontinuedOperationsMember
2015-12-01
2016-11-30
0000721447
2017-06-01
2017-08-31
0000721447
2017-09-01
2017-11-30
0000721447
2017-03-01
2017-05-31
0000721447
2016-12-01
2017-02-28
0000721447
2015-12-01
2016-02-29
0000721447
2016-09-01
2016-11-30
0000721447
2016-03-01
2016-05-31
0000721447
2016-06-01
2016-08-31
0000721447
us-gaap:DirectorMember
2016-12-01
2017-11-30
0000721447
caw:A2015CCAIndustriesIncentivePlanMember
2015-08-13
0000721447
caw:EmployeeMember
2017-06-20
2017-06-20
0000721447
us-gaap:DirectorMember
2017-10-02
0000721447
us-gaap:DirectorMember
2017-10-02
2017-10-02
0000721447
caw:EmployeeMember
2017-06-20
0000721447
caw:EmployeeMember
2016-12-01
2017-11-30
0000721447
caw:A2015CCAIndustriesIncentivePlanMember
2017-06-07
0000721447
caw:ExercisePriceTwoMember
2017-11-30
0000721447
caw:ExercisePriceSixMember
2017-11-30
0000721447
caw:ExercisePriceFiveMember
2017-11-30
0000721447
caw:ExercisePriceSevenMember
2017-11-30
0000721447
caw:ExercisePriceThreeMember
2017-11-30
0000721447
caw:ExercisePriceFourMember
2017-11-30
0000721447
caw:ExercisePriceOneMember
2017-11-30
0000721447
caw:ExercisePriceOneMember
2016-12-01
2017-11-30
0000721447
caw:ExercisePriceTwoMember
2016-12-01
2017-11-30
0000721447
caw:ExercisePriceSevenMember
2016-12-01
2017-11-30
0000721447
caw:ExercisePriceThreeMember
2016-12-01
2017-11-30
0000721447
caw:ExercisePriceEightMember
2017-11-30
0000721447
caw:ExercisePriceFourMember
2016-12-01
2017-11-30
0000721447
caw:ExercisePriceEightMember
2016-12-01
2017-11-30
0000721447
caw:ExercisePriceSixMember
2016-12-01
2017-11-30
0000721447
caw:ExercisePriceFiveMember
2016-12-01
2017-11-30
0000721447
2017-06-20
2017-06-20
0000721447
caw:EmployeeMember
2016-06-22
2016-06-22
0000721447
2015-12-01
2015-12-01
0000721447
us-gaap:DirectorMember
2016-06-22
2016-06-22
0000721447
2015-01-05
2015-01-05
0000721447
2017-10-02
2017-10-02
0000721447
2015-04-09
2015-04-09
0000721447
2016-10-05
2016-10-05
0000721447
caw:A2015CCAIndustriesIncentivePlanMember
2005-06-15
0000721447
caw:BoardofDirectorsChairmanandChiefExecutiveOfficerMember
2014-12-01
2014-12-31
0000721447
caw:BoardofDirectorsChairmanandChiefExecutiveOfficerMember
2014-12-30
2015-11-19
0000721447
2015-12-01
2015-12-31
0000721447
caw:BoardofDirectorsChairmanandChiefExecutiveOfficerMember
2014-12-01
2015-11-30
0000721447
caw:BoardofDirectorsChairmanandChiefExecutiveOfficerMember
2015-12-01
2016-11-30
0000721447
caw:BoardofDirectorsChairmanandChiefExecutiveOfficerMember
2017-06-01
2017-11-30
0000721447
caw:BoardofDirectorsChairmanandChiefExecutiveOfficerMember
us-gaap:ScenarioForecastMember
2017-12-01
2018-11-30
0000721447
caw:BoardofDirectorsChairmanandChiefExecutiveOfficerMember
2016-12-01
2017-11-30
0000721447
caw:BoardofDirectorsChairmanandChiefExecutiveOfficerMember
2017-11-30
0000721447
us-gaap:MinimumMember
caw:UltimarkProductsIncMember
2017-03-23
2017-03-23
0000721447
us-gaap:StockOptionMember
2015-12-01
2016-11-30
0000721447
us-gaap:StockOptionMember
2014-12-01
2015-11-30
0000721447
us-gaap:WarrantMember
2016-12-01
2017-11-30
0000721447
us-gaap:StockOptionMember
2016-12-01
2017-11-30
0000721447
us-gaap:WarrantMember
2015-12-01
2016-11-30
0000721447
caw:CreditAgreementMember
us-gaap:LoansPayableMember
us-gaap:SubsequentEventMember
2018-02-05
0000721447
caw:EmersonGroupMember
2016-12-01
2017-11-30
0000721447
caw:CreditAgreementMember
us-gaap:LoansPayableMember
us-gaap:SubsequentEventMember
us-gaap:LondonInterbankOfferedRateLIBORMember
2018-02-05
2018-02-05
0000721447
caw:AdvantageSalesandMarketingMember
us-gaap:SubsequentEventMember
2018-01-15
2018-01-15
0000721447
us-gaap:RevolvingCreditFacilityMember
caw:CreditAgreementMember
us-gaap:SubsequentEventMember
2018-02-05
0000721447
caw:AdvantageSalesandMarketingMember
us-gaap:MinimumMember
us-gaap:SubsequentEventMember
2018-01-15
2018-01-15
0000721447
us-gaap:RevolvingCreditFacilityMember
caw:CreditAgreementMember
us-gaap:SubsequentEventMember
us-gaap:BaseRateMember
2018-02-05
2018-02-05
0000721447
us-gaap:RevolvingCreditFacilityMember
caw:CreditAgreementMember
us-gaap:SubsequentEventMember
2018-02-05
2018-02-05
0000721447
caw:AdvantageSalesandMarketingMember
us-gaap:MaximumMember
us-gaap:SubsequentEventMember
2018-01-15
2018-01-15
0000721447
us-gaap:ScenarioForecastMember
2017-12-01
2018-02-28
0000721447
us-gaap:RevolvingCreditFacilityMember
caw:CreditAgreementMember
us-gaap:SubsequentEventMember
us-gaap:LondonInterbankOfferedRateLIBORMember
2018-02-05
2018-02-05
0000721447
caw:CreditAgreementMember
us-gaap:LoansPayableMember
us-gaap:SubsequentEventMember
us-gaap:BaseRateMember
2018-02-05
2018-02-05
0000721447
us-gaap:RevolvingCreditFacilityMember
caw:CreditAgreementMember
us-gaap:MaximumMember
us-gaap:SubsequentEventMember
2018-02-05
0000721447
caw:CreditAgreementMember
us-gaap:LoansPayableMember
us-gaap:SubsequentEventMember
2018-02-05
2018-02-05
0000721447
us-gaap:AllowanceForSalesReturnsMember
2015-11-30
0000721447
us-gaap:AllowanceForDoubtfulAccountsMember
2014-11-30
0000721447
us-gaap:AllowanceForPromotionsMember
2014-12-01
2015-11-30
0000721447
caw:AccrualForReturnsMember
2014-11-30
0000721447
us-gaap:AllowanceForSalesReturnsMember
2014-11-30
0000721447
caw:AccrualForCooperativeAdvertisingInAccruesLiabilitiesMember
2015-12-01
2016-11-30
0000721447
us-gaap:InventoryValuationReserveMember
2014-12-01
2015-11-30
0000721447
us-gaap:AllowanceForSalesReturnsMember
2016-12-01
2017-11-30
0000721447
us-gaap:AllowanceForDoubtfulAccountsMember
2016-12-01
2017-11-30
0000721447
us-gaap:InventoryValuationReserveMember
2016-11-30
0000721447
us-gaap:AllowanceForDoubtfulAccountsMember
2015-11-30
0000721447
us-gaap:InventoryValuationReserveMember
2016-12-01
2017-11-30
0000721447
caw:AccrualForReturnsMember
2015-12-01
2016-11-30
0000721447
us-gaap:AllowanceForDoubtfulAccountsMember
2014-12-01
2015-11-30
0000721447
us-gaap:AllowanceForPromotionsMember
2015-11-30
0000721447
us-gaap:AllowanceForSalesReturnsMember
2016-11-30
0000721447
caw:AccrualForCooperativeAdvertisingInAccruesLiabilitiesMember
2017-11-30
0000721447
us-gaap:AllowanceForSalesReturnsMember
2017-11-30
0000721447
us-gaap:AllowanceForDoubtfulAccountsMember
2016-11-30
0000721447
caw:AccrualForCooperativeAdvertisingInAccruesLiabilitiesMember
2014-11-30
0000721447
us-gaap:AllowanceForPromotionsMember
2017-11-30
0000721447
us-gaap:AllowanceForPromotionsMember
2014-11-30
0000721447
caw:AccrualForReturnsMember
2015-11-30
0000721447
us-gaap:InventoryValuationReserveMember
2015-11-30
0000721447
us-gaap:AllowanceForSalesReturnsMember
2015-12-01
2016-11-30
0000721447
us-gaap:AllowanceForSalesReturnsMember
2014-12-01
2015-11-30
0000721447
us-gaap:InventoryValuationReserveMember
2015-12-01
2016-11-30
0000721447
us-gaap:AllowanceForDoubtfulAccountsMember
2015-12-01
2016-11-30
0000721447
us-gaap:AllowanceForPromotionsMember
2015-12-01
2016-11-30
0000721447
us-gaap:InventoryValuationReserveMember
2017-11-30
0000721447
caw:AccrualForCooperativeAdvertisingInAccruesLiabilitiesMember
2015-11-30
0000721447
caw:AccrualForCooperativeAdvertisingInAccruesLiabilitiesMember
2016-11-30
0000721447
us-gaap:AllowanceForPromotionsMember
2016-12-01
2017-11-30
0000721447
caw:AccrualForReturnsMember
2014-12-01
2015-11-30
0000721447
caw:AccrualForReturnsMember
2016-11-30
0000721447
us-gaap:AllowanceForDoubtfulAccountsMember
2017-11-30
0000721447
caw:AccrualForReturnsMember
2017-11-30
0000721447
caw:AccrualForReturnsMember
2016-12-01
2017-11-30
0000721447
us-gaap:AllowanceForPromotionsMember
2016-11-30
0000721447
caw:AccrualForCooperativeAdvertisingInAccruesLiabilitiesMember
2014-12-01
2015-11-30
0000721447
us-gaap:InventoryValuationReserveMember
2014-11-30
0000721447
caw:AccrualForCooperativeAdvertisingInAccruesLiabilitiesMember
2016-12-01
2017-11-30
caw:position
caw:extension
xbrli:shares
iso4217:USD
caw:product_line
iso4217:USD
xbrli:shares
utreg:sqft
iso4217:USD
utreg:sqft
xbrli:pure
caw:agreement_renewal
caw:employee
UNITED STATES
SECURITIES AND EXCHANGE COMMISSION
Washington, D.C. 20549
FORM 10-K
Annual Report Pursuant to Section 13 or 15(d) of
the Securities Exchange Act of 1934
For the Fiscal Year Ended November 30, 2017
Commission File Number 001-31643
CCA INDUSTRIES, INC.
(Exact Name of Registrant as specified in Charter)
|
| | |
DELAWARE | | 04-2795439 |
(State or other jurisdiction of incorporation or organization) | | (I.R.S. Employer Identification No.) |
1099 Wall Street West, Suite 275, Lyndhurst, NJ 07071
(Address of principal executive offices, including zip code)
(201) 935-3232
(Registrant’s telephone number, including area code)
Securities registered pursuant to Section 12(b) of the Act:
|
| | |
| | |
Title of class | | Name of each exchange on which registered |
Common Stock, par value $0.01 per share | | New York Stock Exchange: MKT |
Class A Common Stock, par value $0.01 per share | | New York Stock Exchange: MKT |
Securities registered pursuant to Section 12(g) of the Act: NONE
Indicate by check mark if the Registrant is a well-known seasoned issuer, as defined in Rule 405 of The Securities Act. Yes ¨ No ý
Indicate by check mark if the Registrant is not required to file reports pursuant to Section 13 or Section 15(d) of the Act. Yes ¨ No ý
Indicate by check mark whether the Registrant (1) has filed all reports required to be filed by Section 13 or 15 (d) of the Securities Exchange Act of 1934 during the preceding 12 months (or for such shorter period that the Registrant was required to file such reports), and (2) has been subject to such filing requirement for the past 90 days. Yes ý No ¨
Indicate by check mark whether the Registrant has submitted electronically and posted on its corporate website, if any, every interactive data file required to be submitted and posted pursuant to Rule 405 of Regulation S-T (§232.405 of this chapter) during the preceding twelve months (or for such shorter period that the Registrant was required to submit and post such files. Yes ý No ¨
Indicate by check mark if disclosure of delinquent filers pursuant to Item 405 of Regulation S-K is not contained herein, and will not be contained, to the best of Registrant’s knowledge, in definitive proxy or information statements incorporated by reference in Part III of this Form 10-K or any amendment to this Form 10-K. ¨
Indicate by check mark whether the Registrant is a large accelerated filer, an accelerated filer, a non-accelerated filer or a smaller reporting company. See the definitions of “large accelerated filer”, “accelerated filer”, “smaller reporting company” or "emerging growth company" as defined in Rule 12b-2 of the Exchange Act.
|
| | | | | | |
Large accelerated filer | | [ ] | | Accelerated filer | | [ ] |
Non-accelerated filer | | [ ] (Do not check if a smaller reporting company) | | Smaller reporting company | | [X] |
| | | | Emerging growth company | | [ ] |
If an emerging growth company, indicate by check mark if the registrant has elected not to use the extended transition period for complying with any new or revised financial accounting standards provided pursuant to Section 13(a) of the Exchange Act. ¨
Indicate by check mark whether the Registrant is a shell company (as defined in Rule 12b-2 of the Exchange Act). Yes ¨ No ý
The aggregate market value of the voting stock held by non-affiliates of the Registrant (i.e., by persons other than officers and directors of the Registrant and holders of 10% or more of the Registrant’s voting stock), at the closing sales price of $3.30 on May 31, 2017, was as follows:
|
| | |
| | |
Class of Voting Stock | Market Value |
4,760,960 | shares; Common Stock, $.01 par value | $15,711,168 |
On February 15, 2018 there were 6,488,982 shares of Common Stock and 967,702 shares of Class A Common Stock of the Registrant outstanding. Our Class A Common Stock is held by one holder and is not actively traded.
TABLE OF CONTENTS
PART I
Cautionary Statements Regarding Forward-Looking Statements
Our disclosure and analysis in this report contains forward-looking information that involves risks and uncertainties. Our forward-looking statements express our current expectations or forecasts of possible future results or events, including projections of future performance, liquidity, statements of management’s plans and objectives, future contracts, and forecasts of trends and other matters, and you can identify these statements by the fact that they do not relate strictly to historic or current facts and often use words such as “anticipate”, “estimate”, “expect”, “believe”, “will”, “will likely result”, “plan”, “should”, “outlook”, “project” and other words and expressions of similar meaning. We can give no assurance that such expectations or forward-looking statements will prove to be correct. An occurrence of or any material adverse change in one or more of the risk factors or risks and uncertainties referred to in this report or included in our other public disclosures or our other periodic reports or other documents or filings filed with or furnished to the SEC could materially and adversely affect our continuing operations and our future financial results, cash flows, available credit, prospects and liquidity. Forward-looking statements speak only as of the date of this filing, and we undertake no obligation to update or revise such statements to reflect new circumstances or unanticipated events or other circumstances affecting such forward-looking statements occurring after the date of this report, even if such results, changes or circumstances make it clear that any forward-looking information will not be realized. Any public statements or disclosures by us following this report which modify or impact any of the forward-looking statements contained in this report will be deemed to modify or supersede such statements in this report. No assurance can be given that the results in any forward-looking statement will be achieved and actual results could be affected by one or more factors, which could cause actual results to differ materially from such forward-looking statements. Factors that may cause actual results to differ materially from those contemplated by such forward-looking statements include those risk factors listed under the “Risk Factors” section of this Annual Report on Form 10-K and other risks and uncertainties identified below.
All of the information concerning our future liquidity, future net sales, margins and other future financial performance and results, achievement of operating plan or forecasts for future periods, sources and availability of credit and liquidity, future cash flows and cash needs, success and results of strategic and operating initiatives, anticipated cost savings and other reduced spending, and other future financial performance or financial position, as well as our assumptions underlying such information, constitute forward-looking information. Our forward-looking statements are based on a series of expectations, assumptions, estimates and projections about the Company, are not guarantees of future results or performance and involve substantial risks and uncertainty, including assumptions and projections concerning our internal operating plan, operating cash flows, liquidity and sources and availability of credit for all forward periods. Our business and our forward-looking statements involve substantial known and unknown risks and uncertainties, including the following risks and uncertainties:
| |
• | the risks associated with our efforts to successfully implement, adjust as appropriate and achieve the benefits of our current strategic initiatives and any other future initiatives that we may undertake; |
| |
• | the ability to achieve our operating plan for net sales, working capital and cash flows for fiscal 2018 and 2019; |
| |
• | the satisfaction of all borrowing conditions under our line of credit, including accuracy of all representations and warranties, no defaults or events of default, absence of material adverse effect or change and all other borrowing conditions, and sufficiency of borrowing base; |
| |
• | the risks associated with our efforts to maintain our customers and expand to attract new customers; |
| |
• | continued credit from vendors at existing future expected levels and with acceptable payment terms; |
| |
• | the ability to attract and retain talented and experienced executives that are necessary to execute our initiatives; |
| |
• | the ability to accurately estimate and forecast future selling and other future financial results and financial position; and |
| |
• | any impact to or disruption in our supply of merchandise. |
The cautionary statements made in this Annual Report on Form 10-K should be read as being applicable to all forward-looking statements whenever they appear in this Annual Report. For these statements, we claim the protection of the safe harbor for forward-looking statements contained in the Private Securities Litigation Reform Act. In addition to
the information set forth in this report, you should carefully consider the risk factors and risks and uncertainties included in this report and other periodic reports filed with the SEC.
Item 1. BUSINESS
(a) General
CCA INDUSTRIES, INC. (hereinafter, “CCA” or the “Company”) was incorporated in Delaware in 1983. CCA does business under the trade name Core Care America.
The Company operates in one industry segment, in what may be generally described as fast moving consumer goods, selling numerous products in multiple health-and-beauty aids, over the counter drug and remedies and cosmeceutical categories. All of the Company’s products are manufactured by contract manufacturers, pursuant to the Company’s specifications and formulations.
The Company owns registered trademarks, or exclusive licenses to use registered trademarks, that identify its products by brand-name. Under most of the brand names, the Company markets several different but categorically-related products. The principal brand and trademark names include “Plus+White” (oral health-care products),“Sudden Change” (skin-care products), “Nutra Nail” (nail treatments), “Bikini Zone” (pre and after-shave products), "Porcelana" (skin-care products), “Hair Off” (depilatories), “Solar Sense” (sun-care products), “Sunset Cafe” (perfumes), “Lobe Miracle” (ear-care product) and “Scar Zone” (scar diminishing cream).
All Company products are marketed and sold to major drug, food chains, mass merchandisers and wholesale beauty aids distributors throughout the United States, as well as internet sales. In addition, certain of the Company’s products are sold internationally, through distributors.
The Company recognizes sales at the time its products are shipped to customers. However, while sales are not formally subject to any contract contingency, returns are accepted if it is in the best interests of the Company’s relationship with the customer. The Company thus estimates ‘unit returns’ based upon a review of the market’s recent-historical acceptance of subject products as well as current market-expectations, and calculates its reserves for estimated returns based on the historical returns as a percentage of sales in the three preceding months, adjusting for returns that can be put back into inventory, and a specific reserve based on customer circumstances, (See "Revenue Recognition" in Note 2 of the consolidated financial statements). Of course, there can be no precise going-forward assurance in respect to return rates and gross margins, and a significant increase in the rate of returns could have a materially adverse effect upon the Company’s financial condition and results of operations.
The Company’s net sales in fiscal 2017 were $19,813,262. Gross profits were $12,365,486. International sales accounted for approximately 12.4% of net sales. The Company had net income of $1,831,181 for fiscal 2017. Total shareholders' equity at November 30, 2017 was $9,907,193.
Including the principal members of management (see Item 10. Directors, Executive Officers and Corporate Governance), the Company, at November 30, 2017, had a total of 12 employees in the areas of sales, administrative, marketing, accounting, and operations.
(b) Manufacturing and Shipping
The Company creates and/or oversees formulations and arranges with independent contractors for the manufacture of its products pursuant to Company specifications. During fiscal 2017, the Company had research and development costs of $58,920 as compared to $46,382 in fiscal 2016. Manufacturing and component-supply arrangements are maintained with various manufacturers and suppliers. The Company has moved most of its manufacturing to be "turn-key", with the contract manufacturer supplying the Company with a finished good. A small amount of manufacturing requires the Company to purchase components and packaging material that are then supplied to the contract manufacturer. All order processing, invoicing, deduction management and accounts receivable collections were outsourced to The Emerson Group who contracted for product deliveries with Ozburn-Hessey Logistics, one of the largest integrated global supply chain management companies in the United States (“OHL”),
from OHL's managed facility in Indianapolis, Indiana. Effective January 15, 2018, the Company terminated its contract with The Emerson Group and outsourced order processing, invoicing, deduction management and accounts receivable collections to Advantage Sales and Marketing. In conjunction with that, the Company also signed a contract with Casestack, Inc. ("Casestack"), a supply chain management company, who will warehouse the Company's inventory and ship orders to the Company's customers. The Casestack warehouse is located in Scranton, Pennsylvania.
(c) Marketing
The Company markets its products to major drug, food and mass-merchandise retail chains, warehouse clubs and leading wholesalers, through independent sales representatives throughout the United States, and through distributors internationally.
The Company sells its products to approximately 250 accounts, most of which have numerous outlets. Approximately 40,000 stores carry at least one Company product (SKU). During the fiscal year ended November 30, 2017, the Company’s largest customers were Wal-Mart (approximately 36.3% of net sales), Walgreens (approximately 13.4%) and Target (approximately 6.9%). The loss of any of these principal customers, or substantial reduction of sales revenues realized from their business, could materially and negatively affect the Company’s earnings.
Most of the Company’s products are not particularly susceptible to seasonal-sales fluctuation. However, retail sales of depilatory, shave and sun-care products customarily peak in the spring and summer months.
The Company works with external resources to create media advertising, packaging and point-of-purchase displays.
The Company primarily utilizes national cable and satellite television advertisements to promote its leading brands. In addition, and on a generally continuous basis, store-centered product promotions are co-operatively undertaken with customers.
Each of the Company’s brand-name products is intended to attract a particular demographic segment of the consumer market, and advertising campaigns are directed to the respective market-segments. The Company targets the following demographic segments and utilizes these specific marketing approaches for each of these core brands:
Bikini Zone: Designed to help women relieve the bumps, irritation and redness that can accompany hair removal in the bikini area, the brand is targeted primarily to women aged 18-35 years who remove body hair. Sales volume is seasonal with peak volume occurring between Memorial Day and the July 4th holiday as people prepare for outdoor activity and the swimming season. Marketing efforts are concentrated around this peak season and include in-store displays and secondary placement.
Porcelana: Designed to help treat skin discoloration, including dark spots, sun spots and hyperpigmentation, the brand is marketed to women aged 25-54 years.
Plus White: Designed to help consumers whiten their teeth and maintain good oral hygiene, the brand is targeted primarily to women aged 25-54 years, and secondarily to men aged 25-54 years who are concerned about the health and appearance of their teeth. Marketing efforts include national television advertising, in-store displays and secondary placement, and in-pack cross-promotional coupons throughout the year.
Sudden Change: Designed to help women look their best by reducing the appearance of these signs of aging: wrinkles, dark circles, and dullness. Sudden Change brand is targeted primarily to women, aged 34 years and older. Marketing efforts include national TV advertising, in-store displays and in-pack cross-promotional coupons.
Funston Media Management, which is owned by Lance Funston, the Company's Chairman of the Board and Chief Executive Officer, is responsible for the placement of its media advertising (see Item 13 - Certain Relationships and Related Transactions for further information on Funston Media Management).
(d) “Wholly-Owned” Products
The majority of the Company’s sales revenues are from sales of the Company’s “wholly-owned” product lines (i.e., products sold under trademark names owned by the Company, and not subject to any other party’s interest or license), which include principally “Plus+White”, “Sudden Change”, “Bikini Zone”, “Sunset Cafe”, and “Scar Zone”.
(e) All Products
During the fiscal year ended November 30, 2017, the Company’s net sales by category percentage were: Skin Care 52.6%; Oral Care 37.8%; Nail Care 0.5%; Fragrance 5.9%; and Miscellaneous 3.2%.
(f) License-Agreements Products
i. Inspired Beauty Brands, Inc. (formerly Alleghany Pharmacal Corporation)
In 1986, the Company entered into a license agreement with Alleghany Pharmacal Corporation now known as Inspired Beauty Brands, Inc. (the "Inspired Beauty License"). The license agreement, which is for the exclusive rights to Nutra Nail, Hair Off, Properm and IPR-3 was amended in 2011. The Company no longer markets products under the Properm and IPR-3 brand names. The Inspired Beauty License agreement, as amended, requires the Company to pay a royalty rate of 2.5% on net sales of said licensed products, and a minimum royalty of $250,000 per annum. The license agreement was further amended to eliminate the minimum royalty payment effective July 1, 2016 and continuing until June 30, 2017. Concurrent during the period that eliminates the minimum royalty, the royalty rate was changed to 10.0% of gross sales. The Company anticipates entering into an amended license agreement that will permanently eliminate the minimum royalty and increase the royalty rate to 10.0% of gross sales. The Company incurred royalties of $64,889 for Alleghany Pharmacal for the fiscal year ended November 30, 2017.
ii. Solar Sense, Inc.
CCA commenced the marketing of its sun-care products line following a May 1998 License Agreement with Solar Sense, Inc. (the “Solar Sense License”), pursuant to which it acquired the exclusive right to use the trademark names “Solar Sense” and “Kids Sense” and to market products associated with those trademarks. The Solar Sense License requires the Company to pay a royalty of 5% on net sales of said licensed products until $2 million total royalties are paid, at which time the royalty rate will be reduced to 1% for a period of twenty-five years. The Company incurred royalties of $8,622 for Solar Sense, Inc. for the fiscal year ended November 30, 2017. Since the contract inception through November 30, 2017, the Company has incurred a total of $929,551 in royalties to Solar Sense, Inc.
iii. Ultimark Products, Inc.
On March 23, 2017, the Company entered into a license agreement (the “Agreement”) with Ultimark Products, Inc. (“Ultimark”) for the exclusive right to manufacture, market and sell the Porcelana brand of skin care products. The Company’s Chairman of the Board and Chief Executive Officer, Lance Funston, is also the Chairman of the Board and Chief Executive Officer of Ultimark. Porcelana is designed to reduce dark spots and brighten the skin. Under the Agreement, the Company acquired the exclusive right and license to use the Porcelana brand, formulas, packaging designs and trademarks (collectively, the “Porcelana Brand”) in connection with the design, development, manufacture, advertising, marketing, promotion, offering, sale and distribution of Porcelana products worldwide. In addition, the Company purchased all good and saleable inventory of Porcelana products in Ultimark’s possession or control as of April 1, 2017 at Ultimark’s cost, without markup. The Agreement has a term of one year, effective April 1, 2017 and ending March 31, 2018. The Agreement may be renewed, at the Company’s option, for up to two additional one-year terms. The Company intends on renewing the Agreement. The Agreement requires the Company to pay Ultimark a royalty of 10% on the gross sales of Porcelana products manufactured and sold under the Agreement. Royalties are payable quarterly, commencing the first fiscal quarter in which Porcelana products are sold pursuant to the Agreement. There is no minimum royalty for any period under the Agreement. In addition, the Company has the option to purchase the Porcelana Brand from Ultimark during the term of the Agreement for an amount not to exceed $3.2 million, subject to a fairness opinion. In the event of such purchase, the Agreement shall thereafter terminate and
no further royalties or compensation will be due thereunder. The Company incurred costs of $137,241 for the year ended November 30, 2017 for royalties under the Agreement.
iii. Other Licenses
The Company is not party to any other license agreement that is currently material to its operations.
(g) Trademarks
The Company’s own trademarks and licensed-use trademarks serve to identify its products and proprietary interests. The Company considers these marks to be valuable assets. However, there can be no assurance, as a practical matter, that trademark registration results in marketplace advantages, or that the presumptive rights acquired by registration will necessarily and precisely protect the presumed exclusivity and asset value of the marks.
(h) Competition
The market for fast moving consumer goods, in general, is characterized by vigorous competition among producers, many of whom have substantially greater financial, technological and marketing resources than the Company. Major competitors such as Revlon, L’Oreal, Colgate-Palmolive, Coty, Unilever, and Procter & Gamble have the broadest-based public recognition of their products and are significantly larger than us. Moreover, a substantial number of other health-and-beauty aids manufacturers and distributors may also have greater resources than the Company. In order to successfully compete with larger and better funded brands, the Company employs a strategy of uncovering unmet niche needs within large categories, then developing products specifically designed to address those needs. Our marketing strategy seeks to employ highly efficient media buying and direct to consumer techniques to create awareness in the most cost efficient manner possible.
(i) Sources and Availability of Raw Materials and Principal Suppliers
The Company does not manufacture any of its products and instead uses contract manufacturers to produce its products. In a few cases the Company provides raw materials and packaging materials to the contract manufacturer, but in most cases the contract manufacturer sells the Company a turn-key (complete) product. The Company's contract manufacturers produce product based on written purchase orders submitted which specify a quantity of product to be produced. The Company regularly evaluates potential relationships with alternate suppliers. If a particular contract manufacturer was unable to continue producing product for the Company, the Company believes that it could change to an alternate supplier, and depending upon the timing and particular circumstances, this change would not have a material adverse impact on the Company’s business or operations.
The Company does not have a written contract with any of the suppliers of its raw materials other than agreements specifying manufacturing quality standards. The suppliers of components and packaging materials fulfill orders based on a written purchase order specifying the quantity to be supplied. The Company purchases components and packaging from a variety of suppliers and is not dependent on any one supplier. The Company believes that the components and packaging used in its products are commonly available and that there is no material risk as to its ability to obtain future supplies of such materials.
(j) Government Regulation
All of the products that the Company markets are subject or potentially subject to particular regulation by government agencies, such as the U.S. Food and Drug Administration (“FDA”), the Federal Trade Commission, and various state and/or local regulatory bodies. In the event that any future regulations were to require new approval for any in-the-market products, or should require approval for any planned product, the Company would attempt to obtain the necessary approval and/or license, assuming reasonable and sufficient market expectations for the subject product. However, there can be no assurance, that Company efforts in respect of any future regulatory requirements would result in approvals and issuance of licenses. Moreover, if such license-requirement circumstances should arise, delays inherent in any application-and-approval process, as well as any refusal to provide approval, could have a material adverse effect upon the Company's financial condition and existing operations (i.e. concerning in-the-market products) or planned operations.
(k) Cost and Effects of Compliance with Environmental Laws
The costs and effects of compliance with environmental laws are not material to the Company.
Item 1A. RISK FACTORS
Concentration of Risk.
The Company relies on mass merchandisers and major food and drug chains for the sales of its products. The loss of any one of those accounts or substantial reduction of sales revenues realized from their business could have a material negative impact upon our financial condition and results of operations. All of the Company’s products have independent and substantial competition and must be able to effectively compete in order to maintain the Company's position on the retail merchandisers’ shelves. (See Business, Item 1 (c) Marketing.)
We are Dependent on Independent Contract Manufacturers.
The Company does not manufacture any of its products. All of the products are manufactured for the Company by independent contract manufacturers. There can be no assurance that these independent contract manufacturers will manufacture our products in time, in accordance with our specifications or at the level of quality expected. There can be no assurance that the failure of a supplier to deliver the products ordered by the Company, when requested, will not cause burdensome delays in the Company’s shipments to its customers. The Company does constantly seek alternative suppliers in order to reduce costs and to have alternatives should a major supplier fail to deliver as contracted. A failure of the Company to ship as ordered by its customers could cause penalties and/or cancellations of our customers’ orders. In addition, an unanticipated need to transition to a new supplier could result in delays that could impact timely distribution of our products. Any of the foregoing events, depending upon the timing and particular circumstances, could have a material adverse impact on our relationships with our customers and our results of operations, financial condition and business.
There is No Assurance That The Business Will Be Able to Maintain or Increase Net Sales.
In fiscal 2017, net sales were $19,813,262 with net income of $1,831,181. There is no assurance that the Company’s existing products or any new products introduced into the marketplace will be successful.
We may experience periods of declines in sales, especially during periods of economic downturn, and any material reduction in our sales could have a material adverse impact on our results of operations, financial condition and business.
We depend on our existing credit facility, which is based on eligible accounts receivable and inventory.
On February 5, 2018, the Company entered into the Revolving Credit, Term Loan and Security Agreement (the “Credit Agreement”) with PNC Bank, National Association ("PNC"). The Credit Agreement provides for a term loan in an amount of $1,500,000 (the “Term Loan”) and a revolving line of credit up to a maximum of $4,500,000 (the “Revolving Loan” and together with the Term Loan, the “Loans”). The Loans and all other amounts due and owing under the Credit Agreement and related documents are secured by a first priority perfected security interest in, and lien on, substantially all of the assets of the Company. Amounts available for borrowing under the Revolving Loan equal the lesser of the Borrowing Base (as defined below), and $4,500,000, in each case, as the same is reduced by the aggregate principal amount outstanding under the Revolving Loan. “Borrowing Base” under the Credit Agreement means, generally, the amount equal to (i) 85% of the Company’s eligible accounts receivable, plus (ii) 65% of the value of eligible inventory, less (iii) certain reserves. If the Company does not have sufficient eligible accounts receivable and inventory, the ability to borrow under the Credit Agreement may be reduced. The Credit Agreement contains customary representations, warranties and covenants on the part of the Company, including a financial covenant requiring the Company to maintain a fixed charge coverage ratio of no less than 1.10 to 1.0. The Credit Agreement also provides for events of default, including failure to repay principal and interest when due and failure to perform or violation of the provisions or covenants of the agreement. Upon the occurrence of an event of default, PNC may elect to declare the entire unpaid principal balance of the Loans to be immediately due and payable, together with interest and all costs incurred by PNC under the Credit Agreement. See Financial Statements, Note 19 - Subsequent Events for further information relating to the Credit Agreement.
The Company is Dependent on Outsourced Core Function Vendors
The Company has outsourcing agreements with the Advantage Sales and Marketing, which includes sales, customer service and accounts receivable collection functions, and Casestack for warehousing and shipping functions. While there are other vendors that provide these services, which could be sought as alternative vendors, any disruption in our sales, shipments, collections or any other core outsourced function, could have a material adverse effect on the Company's financial condition, results of operations and business.
The Fast Moving Consumer Goods Segment is Highly Competitive.
The market for cosmetics and perfumes, and health-and-beauty aids products in general, including patent medicines, is characterized by vigorous competition among producers, many of whom have substantially greater financial, technological and marketing resources than the Company. Major competitors such as Revlon, L’Oreal, Colgate-Palmolive, Coty, Unilever, and Procter & Gamble have the broadest-based public recognition of their products and are significantly larger than the Company. Moreover, a substantial number of other health-and-beauty aids manufacturers and distributors have greater resources than the Company and may therefore have the ability to spend more aggressively on research and development, advertising and marketing, and to respond more effectively to changing business and economic conditions. Our inability to successfully compete with our competitors could have a material adverse effect on the Company's financial condition, results of operation and business.
Our Class A Shareholder Retains Control of Board of Directors.
Our Class A Shareholder, Capital Preservation Holdings, LLC has the right to elect four members to the Board of Directors. Capital Preservation Holdings, LLC is controlled by Lance Funston, the Company's Chairman of the Board and Chief Executive Officer, and as a result, Mr. Funston is able to exert significant influence over our business. The holders of our Common Stock have the right to elect three members to the Board of Directors.
Future Success Depends on Continued Success of the Company’s Current Products and New Product Development.
The Company is not financially as strong as the major companies against whom it competes. The ability to successfully introduce new niche products and increase the growth and profitability of its current and new niche brand products will affect the business and prospects of the future of the Company and this ability is dependent upon the creativity and marketing skills of management and its advisors and business partners.
All of the Company’s product must be in compliance with all FDA and state regulations and all products which are being manufactured for the Company by outside suppliers must conform to the FDA’s Good Manufacturing Practices requirements. It is the Company’s responsibility to ascertain that the suppliers conform with these requirements. Damage could be caused to our reputation and our relationships with our customers and consumers if our products do not comply with such legal requirements, or with consumer expectations, which could result in diminished sales or liability claims, either of which could have a material adverse impact on our results of operations, financial condition and business.
The Company Relies On A Few Large Customers For A Significant Portion Of Its Sales.
In fiscal 2017 and 2016, respectively, Wal-Mart Stores Inc. represented 36.3% and 38.7%of the Company’s net sales. The Company’s three largest customers accounted for 56.6% of the Company’s net sales in fiscal 2017. The Company has no agreements with any of its customers to stock its products. The Company’s business would suffer materially if it lost Wal-Mart Stores, Inc. or Walgreens, Inc. as a customer. Any significant reduction in sales to any of the Company’s three top customers could likely have a material adverse effect on the Company’s financial condition and results of operations.
The Price of the Company’s Stock May Be Volatile.
The Company’s stock could fluctuate substantially. There is a limited float of shares tradable. There are factors beyond the Company’s control which may cause the market price of our stock to fluctuate significantly, including
but not limited to the volatility of small cap stocks in general, general stock market conditions, and general economic variations. In addition, variations in the Company’s operating revenues and profits and the timing of advertising commitments may have a material effect on the market price of the Company’s stock.
The Company May Experience Interruptions to Its Business Operations Due to Events Beyond Its Control.
A catastrophic event beyond the Company’s control, such as a natural disaster, health pandemic, cyber-attack, adverse weather event or act of terrorism, that results in the destruction or disruption of any of the Company’s critical business systems or operations could harm its ability to conduct normal business operations and its operating results.
We Depend on Key Personnel.
Our employees are key to the growth and success of our business. This depends, in large part, on our ability to attract, retain and motivate qualified personnel, including our executive officers and key management personnel. If we are unable to attract and retain key personnel, our operating results could be adversely affected.
The Future Growth of the Company Depends on an Effective Marketing Program.
An effective marketing program includes media advertising, in-store merchandising, enhancing distribution, co-operative advertising with our retail partners and product promotions that increase product availability, awareness, and help generate increased sales for our customers. Our inability to develop and implement an effective advertising campaign, marketing or promotional programs, that will succeed in a difficult economic environment and highly competitive marketplace, could have a material adverse effect on our business.
We Sell to International Accounts.
In fiscal 2017, international sales accounted for approximately 12.4% of our total net sales. Our international sales expose the Company to additional risks associated with political or regulatory conditions, the dependence on other economies and foreign currency fluctuations which may diminish demand for U.S. goods and subject us to adverse translation impact. A terrorist attack, the threat of a terrorist attack or foreign military operations or other catastrophic event beyond the Company's control could prevent us from shipping to our international accounts. A loss of or material reduction in our international sales would have a material adverse effect on our business.
Some Raw Materials or Components Used in our Products are Sourced from International Suppliers.
Some of the components used in our products are sourced from international suppliers either by the Company directly or through our outside contract manufacturers. This exposes the Company to an additional risk of increased costs if the foreign currency exchange rates change unfavorably. A terrorist attack, the threat of a terrorist attack or foreign military operations or other catastrophic event beyond the Company's control could prevent the international suppliers from delivering their goods to the Company or contract manufacturers. The interruption of the supply could have a material adverse effect on our business.
We Have Entered into Employment and Change of Control Agreements that would Require Us to Make Substantial Payments in connection with a Change of Control of the Company.
The Company has entered into an Employment Agreement with Stephen A. Heit, the Company's Chief Financial Officer ("the Executive"). The Employment Agreement may, in the event of termination of employment under certain circumstances or a change of control of the Company, result in a lump sum payment equal to three times the Executive’s base annual salary and prior year bonus plus other benefits. In addition, the Company has entered into a severance agreements with Douglas Haas, the Company's President and an employment agreement with one other employee, who is not a named officer, which provide that in the event of termination of employment under certain circumstances or a change of control of the Company, Mr. Haas or the other employee who is not a named officer, as applicable, will be entitled to a lump sum payment equal to one times his base annual salary and prior year bonus plus other benefits.For further information, see Part III, Section 11, Executive Compensation. If the Company was required
to make a substantial payment under any of these agreements, there would be a significant impact to the Company's cash reserves and earnings. For further information, see Part III, Section 11, Executive Compensation.
The Company May Not be Able to Fully Realize its Deferred Tax Assets.
The amounts recognized in the deferred tax asset are management's best estimate of the amount more likely than not to be realized and the actual results could differ from those estimates. In determining the amount more likely than not to be realized, management considered available information and determined the negative objective evidence, primarily recent losses offset by positive objective evidence, including forecasts for future profitability. Future profitability in this competitive industry depends on the successful execution of management's initiatives designed to obtain sales levels and improve operating results. The inability to successfully execute these initiatives could reduce estimates of future profitability, which could affect the Company's ability to realize the deferred tax assets. In addition, changes to future tax rates can also affect the value of the deferred tax assets. The enactment by the United States Government of public law 115-97, an Act to provide for reconciliation pursuant to titles II and V of the concurrent resolution on the budget for fiscal year 2018 (formerly known as the Tax Cut and Jobs Act of 2017) provides for a lower corporate tax rate beginning in fiscal year 2018. This will result in a revaluation of the Company's deferred tax assets in the first quarter of fiscal 2018 and is likely to result in a substantial reduction of value.
Our Business and Operations Would be Adversely Impacted in the Event of a Failure of Our Information Technology Infrastructure and/or Cyber Security Attacks.
Cyber security failure might be caused by computer hacking, malware, computer viruses, worms and other destructive or disruptive software, "cyber-attacks" and other malicious activity. Such events could have an adverse impact on our business, including the theft, destruction, loss, misappropriation or release of confidential information or intellectual property. Operational or business delays may result from the disruption of network or information systems and the subsequent remediation activities. In addition, the networks and information systems of our third-party service providers may be vulnerable to the events described above. The Company outsources its order processing , invoicing and accounts receivable collection to Advantage Sales and Marketing, and is dependent on their maintaining adequate security of their computer systems, hardware and software. The Company also outsources management of the computer hardware, software and network used by its employees to a third party information technology firm. We may be required to expend significant resources to protect against these events or to alleviate problems, including reputational harm, caused by these events or the failure or inadequacy of our security systems, which could have a material adverse effect on our business, financial condition and results of operations.
Item 1B. UNRESOLVED STAFF COMMENTS
None
Item 2. PROPERTIES
In December 2017, the Company moved from its office space at 65 Challenger Road, Suite 340, Ridgefield Park, New Jersey to new office space at 1099 Wall Street West, Suite 275, Lyndhurst, New Jersey. The Company did not need as much office space due to the prior reductions in staff. The facility at Lyndhurst is located in an office building and consists of 1,751 square feet of office and allocated common space with an annual rental cost of $34,144 plus one increase after eighteen months. In addition, the lease provides for the Company to pay an electric charge of $1.75 per square foot per year. The lease is for three years commencing December 15, 2017 and expiring on December 31, 2020. The Company's New Jersey offices house its operations, purchasing and accounting staff.
In June 2017, the Company rented office space at 193 Conshohocken State Road, Penn Valley, Pennsylvania. The Company paid a monthly rental of $1,000 per month during fiscal 2017 commencing June 2017. The rent is
increased to $2,500 per month for fiscal 2018. The building is owned by Lance Funston, the Company's Chief Executive Officer and Chairman of the Board. The Company's Pennsylvania facility houses its marketing and sales staff, as well as the office of the Chief Executive Officer. There is no written lease for the facility.
In April 2015, the Company had moved from its facility at 200 Murray Hill Parkway, East Rutherford, New Jersey to the facility at 65 Challenger Road, Suite 340, Ridgefield Park, New Jersey. The facility at Ridgefield Park is located in an office building and consisted of 7,414 square feet of office and allocated common space with an annual rental cost of $154,458 plus annual increases. Included in the annual rental cost is an electric charge of $1.75 per square foot per year. The lease, with a term of five years and four months, commenced April 10, 2015, and contains a provision for four months of rent at no charge. In January 2018, the Company sub-let the Ridgefield Park facility. The sublet is for an annual rent of $126,038 per year with a term beginning January 1, 2018 and expiring on July 31, 2020. In addition, the sub-tenant is responsible for all electrical charges.
The East Rutherford facility consisted of warehouses and offices totaling approximately 81,000 square feet of space. As a result of the outsourcing to the Emerson Group, the Company had not been using the warehouse space since December 2014. In June 2015, the Company sub-let the East Rutherford facility. The terms of the sublet is for a monthly rent of $36,963 plus all common charges and utilities for a term of six years and ten and a half months, expiring in May 2022. The sub-lease provides for annual increases of 2% per year. The Company's lease for the East Rutherford facility provides for rent currently of $41,973 per month, with annual increases equal to the change in the consumer price index. The lease expires in May 2022.
Item 3. LEGAL PROCEEDINGS
We are involved from time to time in routine legal matters and other claims incidental to our business. We review outstanding claims and proceedings internally and with external counsel as necessary to assess probability and amount of potential loss. These assessments are re-evaluated at each reporting period and as new information becomes available to determine whether a reserve should be established or if any existing reserve should be adjusted. The actual cost of resolving a claim or proceeding ultimately may be substantially different than the amount of the recorded reserve. In the opinion of management, our financial condition, results of operations, and liquidity should not be materially affected by the outcome of such legal proceedings and claims.
Item 4. MINE SAFETY DISCLOSURES
Not applicable.
PART II
Item 5. MARKET FOR REGISTRANT’S COMMON EQUITY, RELATED SHAREHOLDER MATTERS AND ISSUER PURCHASES OF EQUITY SECURITIES
The Company’s Common Stock is traded on the New York Stock Exchange AMERICAN under the symbol “CAW”.
The Company’s Class A Common Stock is listed, but not traded, on the New York Stock Exchange AMERICAN.
The range of high and low sales prices of the Company's Common Stock during each quarter of its 2017 and 2016 fiscal years were as follows:
|
| | | | |
Quarter Ended | | 2017 | | 2016 |
February 28 | | $3.23—$2.35 | | $3.50—$3.00 |
May 31 | | $3.32—$3.05 | | $3.55—$3.26 |
August 31 | | $3.70—$3.10 | | $3.55—$3.08 |
November 30 | | $3.70—$2.90 | | $3.18—$2.25 |
The high and low sales prices for the Company’s Common Stock, on February 27, 2018 were $3.07—$3.07 per share.
As of February 27, 2018, there were approximately 86 individual shareholders of record of the Company’s Common Stock. Based on reports of security position listings and the number of proxies requested by brokers in conjunction with the prior year’s annual meeting of stockholders, we believe there are a substantial number of beneficial holders in various street and depository trust accounts, which represent approximately 600 additional shareholders.
As of February 17, 2018, there was one individual shareholder of record of the Company’s Class A Common Stock.
The dividend policy is at the discretion of the Board of Directors of the Company and will depend on numerous factors, including earnings, financial requirements and general business conditions. Additionally, the debt instruments to which we are a party impose restrictions that can restrict us from making dividends or distributions. We did not pay any dividends in fiscal years 2017 and 2016, and we currently intend to retain all available funds and any future consolidated earnings to fund our operations and the development and growth of our business.
Unregistered Sales. During fiscal 2017, we issued the following equity grants to certain employees and directors without registration in reliance on an applicable exemption from registration under Section 4(a)(2) and Regulation D of the Securities Act:
On June 20, 2017, the Company granted incentive stock options for an aggregate of 232,500 shares to ten employees at $3.30 per share, which was the closing price of the Company's stock on that day. The options vest in equal 20% increments beginning one year after the date of grant, and for each of the four subsequent anniversaries of such date. The options expire on June 19, 2027. The Company had estimated the fair value of the options granted to be $369,419 as of the grant date. Accordingly, the Company recorded a charge against earnings in the amount of $30,785 for the fiscal year ended November 30, 2017.
On October 2, 2017, the Company granted non-qualifed stock options for 75,000 shares to Justin W. Mills, III, a director of the Company, at $3.30 per share, which was the closing price of the Company's stock on that day. The options vest twelve months after the date of grant. The options expire on October 1, 2022. The Company had estimated the fair value of the options granted to be $83,813 as of the grant date. Accordingly, the Company recorded a charge against earnings in the amount of $13,969 for the fiscal year ended November 30, 2017.
Equity Compensation Plan Information. The information set forth in Item 12 of Part II of this Annual Report under the heading "Equiity Compensation Plan Information" is incorporated by reference herein.
Item 6. SELECTED FINANCIAL DATA
|
| | | | | | | | | | | | | | | | | | | | |
| | Years Ended November 30, |
| | 2017 | | 2016 | | 2015 | -1 | 2014 | -2 | 2013 |
Statement of Operations: | | | | | | | | | | |
Sales, Net | | $ | 19,813,262 |
| | $ | 19,610,234 |
| | $ | 24,753,950 |
| | $ | 30,120,299 |
| | $ | 28,763,369 |
|
Income (Loss) from Continuing Operations | | 1,831,181 |
| | 1,192,684 |
| | (3,256,632 | ) | | (2,803,428 | ) | | (3,511,282 | ) |
(Loss) Income from Discontinued Operations | | — |
| | (11,474 | ) | | 12,421 |
| | (5,996,041 | ) | | (2,681,966 | ) |
Net Income (Loss) | | 1,831,181 |
| | 1,181,210 |
| | (3,244,211 | ) | | (8,799,469 | ) | | (6,193,248 | ) |
Earnings (Loss) Per Share: | | | | | | | | | | |
Basic | | | | | | | | | | |
Continuing Operations | | $ | 0.26 |
| | $ | 0.17 |
| | $ | (0.46 | ) | | $ | (0.40 | ) | | $ | (0.50 | ) |
Discontinued Operations | | — |
| | $ | — |
| | $ | — |
| | $ | (0.86 | ) | | (0.38 | ) |
Diluted | | | | | | | | | | |
Continuing Operations | | $ | 0.26 |
| | $ | 0.17 |
| | $ | (0.46 | ) | | $ | (0.40 | ) | | $ | (0.50 | ) |
Discontinued Operations | | $ | — |
| | $ | — |
| | $ | — |
| | $ | (0.86 | ) | | $ | (0.38 | ) |
Weighted Average Number of Shares Outstanding—Basic | | 7,006,684 |
| | 7,006,684 |
| | 7,006,684 |
| | 7,006,684 |
| | 7,037,694 |
|
Weighted Average Number of Shares Outstanding—Diluted | | 7,006,684 |
| | 7,021,764 |
| | 7,006,684 |
| | 7,006,684 |
| | 7,037,694 |
|
|
| | | | | | | | | | | | | | | | | | | | |
| | At November 30, |
Balance Sheet Data: | | 2017 | | 2016 | | 2015 |
| 2014 | -1 | 2013 |
Working Capital (Deficiency) | | $ | 1,730,834 |
| | $ | (1,453,941 | ) | | $ | (2,474,868 | ) | | $ | 900,826 |
| | $ | 12,911,553 |
|
Total Assets | | 15,930,459 |
| | 17,238,232 |
| | 19,150,559 |
| | 21,732,592 |
| | 26,345,749 |
|
Total Liabilities | | 6,023,266 |
| | 9,329,341 |
| | 12,761,418 |
| | 12,166,638 |
| | 9,283,383 |
|
Total Shareholders’ Equity | | 9,907,193 |
| | 7,908,891 |
| | 6,389,141 |
| | 9,565,954 |
| | 17,062,366 |
|
Cash Dividends Declared per Common Share | | $ | — |
| | $ | — |
| | $ | — |
| | $ | — |
| | $ | 0.14 |
|
Item 7. MANAGEMENT’S DISCUSSION AND ANALYSIS OF FINANCIAL CONDITION AND RESULTS OF OPERATIONS
Reference is made to “Item 1A. Risk Factors” and “Cautionary Statements Regarding Forward-Looking Statements” which describe important factors that could cause actual results to differ materially from expectations and non-historical information contained herein. In addition, the following discussion should be read in conjunction with our financial statements and the notes to those statements and other financial information appearing elsewhere in this report.
Overview
For the year ended November 30, 2017, the Company had net income from continuing operations of $1,831,181 and earnings per share, basic and fully diluted of $0.26 , as compared to net income from continuing operations of $1,192,684 and earnings per share, basic and fully diluted of $0.17 for the year ended November 30, 2016. For the year ended November 30, 2017 the Company had no activities from discontinued operations. In the same period of fiscal 2016 the net loss from discontinued operations was $11,474, with losses per share, basic and fully diluted, of
$0.00. The total of continuing and discontinued operations for the year ended November 30, 2017 was net income of $1,831,181 compared to a net income of $1,181,210 for the year ended November 30, 2016.
The Company focused its efforts in fiscal 2017 on improving its cash flow and paying off its remaining obligations as a result of the Company's restructuring efforts in fiscal 2016 and 2015. Accounts payable and accrued liabilities recorded as a current liability decreased to $3,617,543 as of November 30, 2017 from $5,615,756 as of November 30, 2016, a decrease of $1,998,213. In addition, the outstanding balance on the Company's line of credit decreased to $2,016,355 as of November 30, 2017 from $3,277,885 as of November 30, 2016, a decrease of $1,261,530 .
The Company had net cash provided by operations of $1,151,048 for the year ended November 30, 2017 as compared to net cash provided in operations of $744,280 for the year ended November 30, 2016. The Company had current assets of $7,364,732 and current liabilities of $5,633,898 at November 30, 2017. Retained earnings increased to $5,449,583 at November 30, 2017 from $3,618,402 at November 30, 2016. The Company entered into a credit agreement with PNC Bank, National Association on February 5, 2018 (see Financial Statements Note 19 - Subsequent Events for further information).
Advantage Sales and Marketing
The Company moved its master broker sales representation to Advantage Sales and Marketing ("Advantage") from the Emerson Group, effective January 15, 2018. The Company believes that this change will allow the Company to regain distribution that was lost over the past four years and enable better implementation of its co-operative advertising programs with the retailers. Advantage currently represents approximately $20 billion in retail sales of consumer products for a number of clients, and is active in the mass market, chain drug, grocery and club channels. Advantage will charge the Company between 3% and 4% of net sales for sales representation. In addition, Advantage will be managing the Company's order to cash cycle, including accepting incoming retailer orders, EDI services, coordinating with the warehouse for order picking and shipping, invoicing the order, deduction management and accounts receivable collections. Advantage will charge the Company 1% of cash collections for managing the order to cash cycle. The Company expects lower gross sales in the first quarter of fiscal 2018, as compared to the first quarter of fiscal 2017, due to the transition to Advantage and the interruption of the order flow. However, management believes that there will be long term gains that justify the move. The Company also moved its warehousing operations from Geodis Contract Logistics (formerly OHL) to Casestack effective January 15, 2018. The Geodis warehouse was located in Plainfield, Indiana. The Casestack warehouse is located outside of Scranton, Pennsylvania. The Company expects a small increase in freight out costs to be offset by lower freight in costs.
Comparison of Operating Results for Fiscal Years 2017 and 2016
For the year ended November 30, 2017, the Company had total revenues of $19,830,098 and net income from continuing operations of $1,831,181 after a provision for income taxes of $1,173,554. For the year ended November 30, 2016, the Company had total revenues of $19,628,744, and net income from continuing operations of $1,192,684, after a provision for income taxes of $948,533. The basic and fully diluted earnings per share from continuing operations for fiscal 2017 was $0.26 as compared to basic and fully diluted earnings per share from continuing operations of $0.17 for fiscal 2016.
The Company’s net sales increased to $19,813,262 for the fiscal year ended November 30, 2017 from $19,610,234 for the fiscal year ended November 30, 2016.
Sales returns and allowances were 5.3% of gross sales for fiscal 2017 as compared to 9.0% for fiscal 2016. Returns were higher in fiscal 2016 due to the Company eliminating unprofitable items in its product line, resulting in retailer returns. Coupon expense, charged against sales allowances, was $6,277 in fiscal 2017 as compared to $45,369 in fiscal 2016. The Company, on an ongoing basis, has returns of products that have been phased out and replaced by new items as part of its marketing plans.
In accordance with accounting principles generally accepted in the United States of America (“GAAP”), the Company reclassified certain advertising and promotional expenditures as a reduction of sales rather than report them as an expense, which had no effect on net income. This reclassification is in accordance with ASC Topic 605-10-S99, “Revenue Recognition” as more fully described in Note 2 (“Sales Incentives”) of the consolidated financial statements for fiscal 2017. The reclassification reflects a reduction in net sales for the fiscal years ended November
30, 2017 and 2016 by $220,535 and $1,149,644 respectively. Included in the reclassification were a write off of older co-operative advertising commitments as a result of completion of customer post audit reviews. Open cooperative advertising that was accrued for in previous years was decreased by $817,972 for the fiscal year ended November 30, 2017. For the fiscal year ended November 30, 2016, the reserve for open cooperative advertising was decreased $589,167. The net effect of the decrease was an increase in net sales.
The Company’s net sales, by category for fiscal 2017 as compared to fiscal 2016 were:
|
| | | | | | | | | | | | | | |
| | Years Ended November 30, |
| | 2017 | | 2016 |
Category | | Net Sales | | | | Net Sales | | |
Skin Care | | $ | 10,438,810 |
| | 52.6 | % | | $ | 10,602,832 |
| | 54.0 | % |
Oral Care | | 7,481,398 |
| | 37.8 | % | | 7,595,244 |
| | 35.3 | % |
Nail Care | | 100,829 |
| | 0.5 | % | | (24,342 | ) | | * |
|
Fragrance | | 1,167,288 |
| | 5.9 | % | | 927,256 |
| | 4.7 | % |
Miscellaneous | | 624,937 |
| | 3.2 | % | | 140,319 |
| | 0.7 | % |
Analgesic | | — |
| | — | % | | 368,925 |
| | 1.9 | % |
Hair Care | | — |
| | — | % | | — |
| | — | % |
| | $ | 19,813,262 |
| | 100.0 | % | | $ | 19,610,234 |
| | 100.0 | % |
Net sales were affected by the following factors:
| |
• | Net sales of skin care products decreased $164,022 for the twelve months ended November 30, 2017, as compared to the same period in 2016. The decrease in net sales was primarily due to lower gross sales of the Company's skin care products as a result of lost distribution. The Company expects to begin regaining lost distribution in fiscal 2018 with the move of sales representation to Advantage. |
| |
• | Net sales of oral care products decreased $113,846 for the twelve months ended November 30, 2017 as compared to the same period in fiscal 2016. Gross sales were lower primarily due to decreased volume on toothpaste. The Company expects to expand distribution of its teeth whitening products with the move of sales presentation to Advantage beginning in fiscal 2018. |
| |
• | Net sales of nail care products increased $125,171 for the twelve months ended November 30, 2017 as compared to the same period in fiscal 2016. The net sales were primarily from close out sales of older inventory. The Company is planning on re-launching the Nutra Nail product line in fiscal 2018. |
| |
• | Net sales of fragrance products increased $240,032 for the twelve months ended November 30, 2017 as compared to the same period in fiscal 2016. The net sales increased due to increased orders from the Company's distributor in Saudi Arabia. Fragrance sales were only to the Saudi Arabia distributor. The Company expects further increases in fiscal 2018. |
Gross profit margins increased to 62.4% in fiscal 2017 from 58.4% in fiscal 2016. The increase was primarily due to lower sales returns and allowances as a percentage of sales. The total cost of sales as a percentage of gross sales decreased slightly to 34.3% in fiscal 2017 as compared to 35.8% in fiscal 2016. The Company is continually working with its contract manufacturers to reduce the cost of goods, and also in some cases seeks out new contract manufacturers in an effort to lower costs.
Selling, general and administrative expenses decreased to $7,052,219 for the year ended November 30, 2017 from $7,434,389 for the 2016 fiscal year. The decrease of $382,170 was as a result of lower outside consulting costs and increases or decreases comprised from a number of smaller expense categories.
Advertising, cooperative and promotions expenses for fiscal 2017 were $1,769,748 as compared to $1,219,413 for fiscal 2016. The increased expense of $550,335 was comprised primarily of increased media advertising of the Company's brands. The Company’s advertising expense changes from year to year based on the timing of the Company’s promotions and the Company's planned advertising campaigns.
Research and development expenses increased to $58,920 for the 2017 fiscal year from $46,382 for the 2016 fiscal year. The Company outsources its regulatory work, as well as utilizing third party contract manufacturers for product development.
The Company had interest expense of $505,872 for the year ended November 30, 2017 as compared to $588,656 for the year ended November 30, 2016. Most of the interest expense was from the Company's borrowing under its Revolving Loan with SCM Specialty Finance Opportunities Fund, L.P., an affiliate of CNH Finance, L.P. The Company expects its interest costs to continue to decrease due to entering into a new credit agreement with PNC Bank (see section 1A. Risk Factors for further information on the new credit agreement), and cash flow generated in fiscal 2018. The interest expense - related party of $3,085 for the year ended November 30, 2016 consisted of interest expense due to Capital Preservation Solutions LLC for the Company's line of credit and term loan. The working capital and term loan under the agreement with Capital Preservation Solutions was paid in full on December 4, 2015, and the agreement expired on December 5, 2015.
Income before provision for income taxes for continuing operations was $3,004,735 for the year ended November 30, 2017, as compared to $2,141,217 for the year ended November 30, 2016.
The effective tax provision for fiscal 2017 was 39.1% of income before tax as compared to 44.3% of income before tax for fiscal 2016. The higher rate in fiscal 2016 was primarily due to a decrease in the valuation of the deferred tax assets in that year which resulted in an increase of $140,483 in the tax provision. The decreased valuation was due to changing the assumption of the realization of future tax benefits at a combined federal and state income tax rate of 36.45% from 36.90%, which was the rate assumed for the fiscal years prior to 2016. The Company expects a material revaluation of its deferred tax assets in the first quarter of fiscal 2018 as a result of the enactment by the United States Government of public law 115-97, an Act to provide for reconciliation pursuant to titles II and V of the concurrent resolution on the budget for fiscal year 2018 (formerly known as the Tax Cut and Jobs Act of 2017). Federal corporate tax rates for periods beginning after January 1, 2018 have been reduced to 21%. The Company's federal rate was previously 34%. The Company values its deferred tax assets and liabilities using the tax rates expected to apply in the years in which those temporary differences are expected to be recovered or settled. The Company, prior to the enactment of public law 115-97, had valued its deferred tax assets and liabilities at a combined federal and state tax rate of 36.45%. Due to the corporate tax rate change, the Company has now estimated that its deferred tax assets and liabilities should be valued based on an estimated future tax rate of 26.85%, effective in the first quarter of fiscal 2018. The change in rate will cause the Company to record an additional tax expense as part of the provision for income tax in the first quarter of fiscal 2018 which likely will result in the Company reporting a net loss after provision for income tax for the quarter.
The Company discontinued the Gel Perfect nail polish brand and sold the Mega-T dietary supplement brand during fiscal 2014. The result of operations of both brands are recorded on the consolidated statement of operations as discontinued operations. The net loss from operations of discontinued brands was $0 in fiscal 2017 as compared to a net loss of $11,474 in fiscal 2016. The loss in fiscal 2016 was due to returns received. The Company does not believe that there will be any further return expense for discontinued operations.
Comparison of Operating Results for Fiscal Years 2016 and 2015
For the year ended November 30, 2016, the Company had total revenues of $19,628,744 and net income from continuing operations of $1,192,684 after a provision for income taxes of $948,533. For the year ended November 30, 2015, the Company had total revenues of $24,789,555, and net loss from continuing operations of $3,256,632, after a benefit from taxes of $1,592,309. Other income decreased to $18,510 for fiscal 2016 as compared to $35,605 for fiscal 2015. The basic and fully diluted earnings per share from continuing operations for fiscal 2016 was $0.17 as compared to a basic and fully diluted loss per share from continuing operations of $0.46 for fiscal 2015.
The Company’s net sales decreased to $19,610,234 for the fiscal year ended November 30, 2016 from $24,753,950 for the fiscal year ended November 30, 2015.
Sales returns and allowances was 9.0% of gross sales for fiscal 2016 and 11.4% for fiscal 2015. Coupon expense, charged against sales allowances, was $45,369 in fiscal 2016 as compared to $117,303 in fiscal 2015. The Company, on an ongoing basis, has returns of products that have been phased out and replaced by new items as part of its marketing plans.
In accordance with accounting principles generally accepted in the United States of America (“GAAP”), the Company reclassified certain advertising and promotional expenditures as a reduction of sales rather than report them as an expense, which had no effect on net income. This reclassification is in accordance with ASC Topic 605-10-S99, “Revenue Recognition” as more fully described in Note 2 (“Sales Incentives”) of the consolidated financial statements for fiscal 2014. The reclassification reflects a reduction in net sales for the fiscal years ended November 30, 2016 and 2015 by $1,149,644 and $2,243,966 respectively.
The Company’s net sales, by category for fiscal 2016 as compared to fiscal 2015 were:
|
| | | | | | | | | | | | | | |
| | Years Ended November 30, |
| | 2016 | | 2015 |
Category | | Net Sales | | | | Net Sales | | |
Skin Care | | $ | 10,602,832 |
| | 54.0 | % | | $ | 12,845,817 |
| | 51.9 | % |
Oral Care | | 7,595,244 |
| | 38.7 | % | | 8,526,601 |
| | 35.3 | % |
Nail Care | | (24,342 | ) | | (0.1 | )% | | 1,829,461 |
| | 7.4 | % |
Fragrance | | 927,256 |
| | 4.7 | % | | 1,034,883 |
| | 4.2 | % |
Miscellaneous | | 140,319 |
| | 0.7 | % | | 402,617 |
| | 1.6 | % |
Analgesic | | 368,925 |
| | 2.0 | % | | 114,980 |
| | 0.5 | % |
Hair Care | | — |
| | — | % | | (409 | ) | | — | % |
| | $ | 19,610,234 |
| | 100.0 | % | | $ | 24,753,950 |
| | 100.0 | % |
Net sales were affected by the following factors:
| |
• | Net sales of skin care products decreased $2,242,985 for the twelve months ended November 30, 2016, as compared to the same period in 2015. The decrease in net sales was primarily due to higher sales incentives given to retailers for the fiscal year ended November 30, 2015 combined with lower gross sales. |
| |
• | Net sales of oral care products decreased $931,357 for the twelve months ended November 30, 2016 as compared to the same period in fiscal 2015. Gross sales were lower primarily due to decreased volume on toothpaste. Sales incentives were higher in fiscal 2016when comparing the two periods. |
| |
• | Net sales of nail care products decreased $1,853,803 for the twelve months ended November 30, 2016 as compared to the same period in fiscal 2015. The net sales decreased primarily due to lower gross sales as a result of the Company no longer selling the Health and Wellness line of Nutra Nail products, offset partially by lower returns, allowances and sales incentives. |
| |
• | Net sales of fragrance products decreased $107,627 for the twelve months ended November 30, 2016 as compared to the same period in fiscal 2015. The net sales decreased primarily due to timing of shipments. Fragrance sales were only to an international customer. |
Gross profit margins increased to 58.4% in fiscal 2016 from 57.8% in fiscal 2015. The increase was primarily due to lower sales returns and allowances as a percentage of sales. The total cost of sales as a percentage of gross sales decreased slightly to 35.8% in fiscal 2016 as compared to 35.9% in fiscal 2015.
Selling, general and administrative expenses decreased to $7,434,389 for the year ended November 30, 2016 from $11,574,045 for the 2015 fiscal year. The decrease of $4,139,656 was as a result of the following:
| |
• | Personnel costs decreased to $2,456,712 in fiscal 2016 from $6,148,670 in fiscal 2015, a decrease of $3,691,958. The decrease in personnel was a result of the Company's restructuring plan. |
| |
• | Freight out, warehousing and outsource charges from Emerson decreased $847,757 comparing fiscal 2016 to fiscal 2015, primarily due to lower gross sales. |
Advertising, cooperative and promotions expenses for fiscal 2016 were $1,219,413 as compared to $3,524,074 for fiscal 2015. The decreased expense of $2,304,661 was comprised of:
| |
• | Decreased media, trade advertising and related expenses of $2,159,959. This decrease is due to decreased spending on the Sudden Change, Bikini Zone, and Plus White brands as the Company turned to more focused advertising. |
| |
• | Market research costs decreased $208,907. |
The Company’s advertising expense changes from year to year based on the timing of the Company’s promotions.
Research and development expenses decreased to $46,382 for the 2016 fiscal year from $75,208 for the 2015 fiscal year. The decrease was due to the Company outsourcing regulatory work, as well as utilizing third party contract manufacturers for product development.
The Company had interest expense to a related party of $3,085 for the year ended November 30, 2016 as compared to $1,735,967 for the year ended November 30, 2015. The interest expense - related party consisted of interest expense due to Capital Preservation Solutions LLC for the Company's line of credit and term loan and deferred financing fees. The deferred financing fees were comprised of the value of the warrant that was issued to Capital Preservation Solutions as well as related legal costs (See Financial Statements Note 7 - Debt Agreement for further information regarding the Capital Preservation Solutions LLC loan agreement). The Company amortized the deferred financing fees over the term of the line of credit and term loan. The loan closed in September 2014, and therefore three months were amortized in fiscal 2014 and twelve months were amortized in fiscal 2015. Total interest expense, comprised of interest expense and interest expense - related party, decreased by $1,159,383 due to lower interest costs as a result of lower borrowing and the decrease in deferred financing fees amortization.
The Company recorded restructuring costs of $0 for fiscal 2016 and $2,289,406 for fiscal 2015. The restructuring charges consisted of severance payments or related accruals to employees in fiscal 2015, and facility exit costs in fiscal 2015. The Company completed its restructuring plan in fiscal 2016 and had no further restructuring charges during the year ended November 30, 2016. During fiscal 2016, the Company's personnel were reduced to 12 employees. The Company incurred facility exit costs in fiscal 2015 of $1,276,477 as a result of exiting and subsequently sub-letting the Company's prior facility at 200 Murray Hill Parkway, East Rutherford, New Jersey. The exit costs included writing off leasehold improvements of $714,138, real estate commissions paid for the sub-lease of $155,245 and a charge of $407,094 as an estimate for the difference between the rent that the Company pays its East Rutherford landlord per the master lease and the rent received from the sub-tenant over the term of the sub-lease. At the end of fiscal 2016, unpaid restructuring costs of $925,000, which are due to be paid in fiscal 2017, were recorded as an accrued expense on the Company's consolidated balance sheet.
Income before provision for income taxes for continued operations was $2,141,217 for the year ended November 30, 2016, as compared to the loss before benefit from income taxes for continued operations of $4,848,941 for the year ended November 30, 2015.
The effective tax provision for fiscal 2016 was 44.3% of income before tax as compared to a tax benefit of 32.8% of the net loss before tax for fiscal 2015. The increase in the rate was primarily due to a decrease in the valuation of the deferred tax assets which resulted in an increase of $140,483 in the current tax provision. The decreased valuation was due to changing the assumption of the realization of future tax benefits at a combined federal and state income tax rate of 36.45% from 36.90%, which was the rate assumed for prior fiscal years.
The Company discontinued the Gel Perfect nail polish brand and sold the Mega-T dietary supplement brand during fiscal 2014. The result of operations of both brands are recorded on the consolidated statement of operations as discontinued operations. The net loss from operations of discontinued brands was $11,474 in fiscal 2016 as compared to net income of $12,421 in fiscal 2015. The loss in fiscal 2016 was due to returns received. The Company does not believe that there will be any further return expense for discontinued operations.
Financial Position as of November 30, 2017
As of November 30, 2017, the Company had working capital of $1,730,834 as compared to a working deficiency of $1,453,941 at November 30, 2016. The ratio of total current assets to current liabilities is 1.3 to 1 as of November 30, 2017, as compared to 0.8 to 1 for the prior year. Working capital increased due to the cash flow generated from the Company's operations. Most of the cash flow was directed towards reducing the Company's accounts payable and accrued liabilities. The Company’s cash position at November 30, 2017 was $140,243, versus cash of $309,280 as at November 30, 2016. The Company had no investments at at November 30, 2017. As of November 30, 2017, there were no dividends declared.
Accounts receivable as of November 30, 2017 and 2016 were $2,585,517 and $2,147,680 respectively. Included in net accounts receivable are an allowance for doubtful accounts, a reserve for returns and allowances and a reduction based on an estimate of co-operative advertising that will be taken as credit against payments. The allowance for doubtful accounts was $6,629 and $15,801 for November 30, 2017 and 2016, respectively. The reserve for returns and allowances is a combination of specific and general reserve amounts relating to accounts receivable. The general reserve is calculated based on historical percentages applied to aged accounts receivable and the specific reserve is established and revised based on individual customer circumstances.
The reserve for returns and allowances is based on the historical returns as a percentage of sales in the three preceding months, adjusting for returns that can be put back into inventory, and a specific reserve based on customer circumstances. This allowance decreased to $356,159 as of November 30, 2017 from $1,136,101 as of November 30, 2016. Of this amount, allowances and reserves in the amount of $109,646, which are anticipated to be deducted from future invoices, are included in accrued liabilities. The reserve for returns and allowances as of November 30, 2016 include specific reserves of $729,414 for Nutra Nail product returns that were deducted in fiscal 2017.
Gross receivables were further reduced by $287,219 as of November 30, 2017, which was reclassified from accrued liabilities, as an estimate of the co-operative advertising that will be taken as a credit against payments. In addition, accrued liabilities include $1,122,904, which is an estimate of co-operative advertising expense relating to fiscal 2017 sales which are anticipated to be deducted from future invoices rather than current accounts receivable.
Inventories were $1,878,831 and $2,347,483, as of November 30, 2017 and 2016, respectively. The decrease in inventory is due to management's efforts to increase inventory turnover, as well as lower sales and the elimination of unprofitable product items. The reserve for inventory obsolescence is based on a detailed analysis of inventory movement. The inventory obsolescence reserve decreased to $158,269 as of November 30, 2017 from $500,156 as of November 30, 2016. Changes to the inventory obsolescence reserves are recorded as an increase or decrease to the cost of sales.
Prepaid expenses and sundry receivables increased to $642,000 as of November 30, 2017 from $466,060 as of November 30, 2016. The increase was in the ordinary course of business.
Prepaid and refundable income taxes decreased to $38,153 as of November 30, 2017, from $44,154 as of November 30, 2016. Prepaid income taxes consist of tax payments or refunds due from federal and various state jurisdictions that the Company files in.
The amount of deferred income tax reflected as a current asset decreased to $2,079,988 as of November 30, 2017 from $2,148,764 as of November 30, 2016. The $68,776 decrease was due primarily to decreases in the Company's reserves partially offset by an increase in the amount of loss carry forward classified as a short-term asset. ASU 2015-17 is effective with the first quarter of fiscal 2018 and will require that all deferred tax assets be classified as long-term. See Recent Accounting Pronouncements below for further information.
The Company’s investment in property and equipment consisted mostly of office furniture and equipment, and computer hardware and software to accommodate our personnel in addition to tools and dies used in the manufacturing process. The Company acquired $54,833 of additional property and equipment during fiscal 2017, primarily for upgrade of workstations for the Company's employees and software.
The Company had intangible assets of $432,320 as of November 30, 2017 as compared to $433,778 as of November 30, 2016. During the fiscal year ended November 30, 2017, the Company write-off $1,070 as part of its annual impairment evaluation of patents and trademarks that were no longer in use with no plans for future use.
The Company had deferred financing fees of $133,322 as of November 30, 2017. On December 4, 2015, the Company entered into the Credit and Security Agreement (the “Credit Agreement”) with SCM Specialty Finance Opportunities Funds, L.P., an affiliate of CNH Finance, L.P. The Credit Agreement provided for a line of credit up to a maximum of $5,500,000 (the “Revolving Loan”). The proceeds of the Revolving Loans were used to pay off the Company's existing debt with Capital Preservation Solutions, LLC and for general working capital purposes. The deferred financing fees were for fees and legal costs incurred in connection with entering into the Credit Agreement. See Financial Statements Note 7 - Debt Agreement for further information regarding the Credit Agreement.
The Company had non-current deferred tax assets of $7,422,331 as of November 30, 2017 as compared to $8,415,699 as of November 30, 2016. The decrease was due to a reallocation of a portion of the deferred tax asset from a non-current asset to a current asset as well as the net income in fiscal 2017 which reduced the loss carry forward.
Current liabilities were $5,633,898 and $8,917,362, as of November 30, 2017 and 2016, respectively. Current liabilities at November 30, 2017 consisted of accounts payable, accrued liabilities, short-term capital lease obligations and income tax payable. Accounts payable and accrued liabilities decreased as the Company's financial position improved and vendor payments were brought to current and accrued restructuring costs were paid. As of November 30, 2017, there was $1,410,123 of open cooperative advertising commitments, of which $349,517 is from 2017, $621,513 is from 2016 and $539,294 is from 2015. In addition, there were reductions in open commitments of $106,694 which had not yet been applied to a specific year. Of the total amount of $1,410,123, $287,219 is reflected as a reduction of gross accounts receivables, and $1,122,904 is recorded as an accrued expense. Cooperative advertising is advertising that is run by the retailers in which the Company shares in part of the cost. If it becomes apparent that this cooperative advertising was not utilized, the unclaimed cooperative advertising will be offset against the expense during the fiscal year in which it is determined that it did not run. This procedure is consistent with the prior year’s methodology with regard to the accrual of unsupported cooperative advertising commitments.
Long-Term Obligations and Credit Agreement
The Company’s long-term obligations as of November 30, 2017 were for a portion of its net sub-lease liability and a security deposit for the sub-lease of its former facility in East Rutherford, New Jersey. The Company incurred facility exit costs as a result of exiting and subsequently sub-letting the Company's prior facility at 200 Murray Hill Parkway, East Rutherford, New Jersey. The exit costs included a charge of $407,094 as an estimate for the difference between the rent that the Company pays its East Rutherford landlord per the master lease and the rent received from the sub-tenant over the term of the sub-lease. This charge was recorded as an accrued expense. The portion of the net sub-lease liability due greater than twelve months was reclassified as a long term liability.
Shareholder's Equity and Cash Flow
Shareholders’ equity increased to $9,907,193 as of November 30, 2017 from $7,908,891 as of November 30, 2016. The increase was due to increases in retained earnings of $1,831,181 as a result of the net income earned in fiscal 2016 and an increase in additional paid-in capital of $167,121 due to the issuances of stock options.
The Company's cash provided by operating activities was $1,151,048 during fiscal 2017, as compared to cash provided of $744,280 during fiscal 2016. The provision of cash in fiscal 2017 was mainly due to the net income from continuing operations of $1,831,181, which included non-cash transactions that in the aggregate were $1,496,923 offset by an aggregated decrease in operating asset and liability accounts of $2,177,056. Net cash used in investing activities was $54,833 in fiscal 2017, primarily due to the acquisition of new computer equipment and software for the Company. Cash flow used in financing activities was $1,265,252 during the year ended November 30, 2017, as a result of decreased borrowing under the Company's line of credit. The Company’s cash balance decreased by $169,037 during fiscal 2017.
Liquidity and Capital Resources
Liquidity is defined as the ability to generate adequate amounts of cash to meet short-term and long-term business needs. We assess our liquidity in terms of our total cash flow and the amounts of cash and credit availability. Significant factors that could affect our liquidity include the following:
| |
• | Cash flow generated or used by operating activities; and |
| |
• | Ability to negotiate favorable payments terms with the Company's contract manufacturers; |
The Company's primary capital needs in fiscal 2018 are working capital requirements to finance increases in accounts receivable as the Company anticipates sales increasing, the media advertising program for fiscal 2018 and to support the transition to Advantage Sales and Marketing.
On December 4, 2015, the Company entered into the Credit and Security Agreement (the “SCM Credit Agreement”) with SCM Specialty Finance Opportunities Funds, L.P., an affiliate of CNH Finance, L.P. (" The SCM"). The Credit Agreement provided for a line of credit up to a maximum of $5,500,000. As of November 30, 2017, $2,016,355 was outstanding under the SCM Credit Agreement. On February 5, 2018, the Company entered into the Revolving Credit, Term Loan and Security Agreement (the “PNC Credit Agreement”) with PNC Bank, National Association. The PNC Credit Agreement provides for a term loan in an amount of $1,500,000 (the “Term Loan”) and a revolving line of credit up to a maximum of $4,500,000 (the “Revolving Loan” and together with the Term Loan, the “Loans”). The proceeds from the Loans were used to pay off the SCM Credit Agreement and for general working capital purposes. See Financial Statements Note 19 - Subsequent Events for further information.
The Term Loan with PNC Bank is payable in consecutive monthly installments of $31,250 commencing March 1, 2018 and bears interest, at the election of the Company, at either the PNC base rate plus 1% or 30, 60 or 90 day LIBOR rate plus 3.50%. All outstanding amounts under the Revolving Loan bear interest, at the election of the Company, at either the PNC base rate plus 0.25% or 30, 60 or 90 day LIBOR rate plus 2.75%, payable monthly in arrears. The Company is also required to pay a quarterly unused line fee and collateral management fee. The commitment under the PNC Credit Agreement expires three years after the Closing Date. The Loans and all other amounts due and owing under the Credit Agreement and related documents are secured by a first priority perfected security interest in, and lien on, substantially all of the assets of the Company. Amounts available for borrowing under the Revolving Loan equal the lesser of the Borrowing Base (as defined below), and $4,500,000, in each case, as the same is reduced by the aggregate principal amount outstanding under the Revolving Loan. “Borrowing Base” under the Credit Agreement means, generally, the amount equal to (i) 85% of the Company’s eligible accounts receivable, plus (ii) 65% of the value of eligible inventory, less (iii) certain reserves. The PNC Credit Agreement contains customary representations, warranties and covenants on the part of the Company, including a financial covenant requiring the Company to maintain a fixed charge coverage ratio of no less than 1.10 to 1.0. The PNC Credit Agreement also provides for events of default, including failure to repay principal and interest when due and failure to perform or violation of the provisions or covenants of the agreement, as a result of which amounts due under the PNC Credit Agreement may be accelerated. On the Closing Date, the Company borrowed the entire $1,500,000 Term Loan and drew $386,130 on
the Revolving Loan. These amounts were used, in part, to pay off the total amount due under the Company's SCM Credit Agreement.
The Company believes that it will have sufficient capital resources to meet its working capital requirements for the next twelve months. This expectation depends upon PNC Bank providing the Company with funds under the line of credit as required and the Company’s ability to borrow additional funds under the line of credit subject to the borrowing base and our future operating performance including the absence of any unforeseen cash requirements.
Based on management's assumptions concerning capital resources and liquidity, which include achieving our internal forecast and operating plan for improved net sales, operating results and operating cash flows and anticipated credit from vendors, it is anticipated that the Company will have sufficient internal and external sources of liquidity to fund operations and anticipated working capital and expected cash needs for the next twelve months. This expectation depends upon future operating performance, the achievement of the Company's operating plan and internal forecast, absence of unforeseen cash requirements, continuation of credit facility availability, PNC Bank providing the Company with funds under the line of credit as required and the Company's ability to borrow additional funds under the line of credit subject to the borrowing base, continued support of vendors at existing levels and the absence of any significant deterioration in economic conditions.
The Company's operating plan for fiscal 2018 forecasts an increase in net sales as compared to fiscal 2017 as a result of increased distribution of the Company's products and better implementation of the Company's co-operative advertising program with the retailers. The Company's ability to achieve its operating plan is based on a number of assumptions which involves significant judgment, risk, and estimates of future performance which cannot be assured.
Critical Accounting Estimates
The Company's consolidated financial statements include the use of estimates, which management believes are reasonable. The process of preparing financial statements in conformity with accounting principles generally accepted in the United States (“GAAP”) requires management to make estimates and assumptions regarding certain types of assets, liabilities, revenues, and expenses. Such estimates primarily relate to unsettled transactions and events as of the date of the financial statements. Accounting estimates and assumptions are those management considers to be most critical to the financial statements because they inherently involve significant judgment and uncertainties. All of these estimates and assumptions reflect management’s best judgment about current economic and market conditions and their effects on the information available as of the date of the consolidated financial statements. Accordingly, upon settlement, actual results may differ from estimated amounts.
An accounting estimate is deemed to be critical if it is reasonably possible that a subsequent correction could have a material effect on future operating results or financial condition. The following are estimates that management has deemed to be critical:
1 - Reserve for Returns—The allowances and reserves which are anticipated to be deducted from gross accounts receivables are recorded as a reserve for returns, which reduces the net accounts receivable. The allowances and reserves which are anticipated to be deducted from future invoices are included in accrued liabilities. The estimated reserve is based in part on historical returns as a percentage of gross sales. The current estimated return rate is 5.07% of gross sales. Management estimates that any returns of product received from customers are not placed back into inventory, and subsequently destroyed. Any changes in this accrued liability are recorded as a debit or credit to the reserve for returns and allowances account. The Company may increase the reserve for returns in excess of the current estimated return rate for specific return circumstances.
2 - Allowance for Doubtful Accounts – The allowance for doubtful accounts is an estimate of the loss that could be incurred if our customers do not make required payments. Trade receivables are periodically evaluated by management for collectability based on past credit history with customers and their current financial condition. Changes in the estimated collectability of trade receivables are recorded in the results of operations for the period in which the estimate is revised. Estimates are made based on specific disputes and additional reserves for bad debt based on the accounts receivable aging ranging from 0.35% for invoices currently due to 2.00% for invoices more than ninety-one
days overdue. Trade receivables that are deemed uncollectible are offset against the allowance for uncollectible accounts. The Company generally does not require collateral for trade receivables.
3 - Inventory Obsolescence Reserve – Management reviews the inventory records on a monthly basis. Management deems to be obsolete finished good items that are no longer being sold, and have no possibility of sale within the ensuing twelve months. Components and raw materials are deemed to be obsolete if management has no planned usage of those items within the ensuing twelve months. In addition, management conducts periodic testing of inventory to make sure that the value reflects the lower of cost of net realizable value. If the value is below market, a provision is made within the inventory obsolescence reserve. This reserve is adjusted monthly, with changes recorded as part of cost of sales in the results of operations.
4 - The deferred taxes are an estimate of the future tax consequences attributable to the temporary differences between the carrying amounts of assets and liabilities as recorded on the Company’s financial statements and the carrying amounts as reflected on the Company’s income tax return. In addition, the portion of charitable contributions that cannot be deducted in the current period and are carried forward to future periods are also reflected in the deferred tax assets. A substantial portion of the deferred tax asset is due to the loss incurred in fiscal 2015 and prior years, the benefit of which will be carried forward into future tax years. Deferred tax assets and liabilities are valued using the tax rates expected to apply in the years in which those temporary differences are expected to be recovered or settled. Deferred tax assets are reduced by a valuation allowance when, in the opinion of management, it is more likely than not that some portion, or all of the deferred tax asset will not be realized. Management has estimated that it will utilize the entire deferred tax asset in future years based on its belief that the Company will continue to be profitable. However profits can be impacted in the future if the Company’s sales decrease. The portion that management expects to utilize in fiscal 2018 is recorded as a short term asset, and the portion that management expects to utilize in fiscal years subsequent to fiscal 2018 are recorded as a long term asset.
5 - Co-operative advertising Reserve – The Co-operative advertising reserve is an estimate of the amount of the liability for the co-operative advertising agreements with the Company’s customers. A portion of the reserve that is estimated to be deducted from future payments is a direct reduction of accounts receivable. The portion that the Company estimates to be deducted from future invoices rather than current accounts receivable is recorded as an accrued expense. Management reviews the co-operative advertising agreements for the current fiscal year with its customers on a monthly basis and adjusts this reserve based on actual co-operative advertising events. The Company maintains an open liability for co-operative advertising contracts for which a customer has not claimed a deduction for the three years prior to the current fiscal year. Management evaluates the open liability for the prior three years on a monthly basis to determine if the liability continues to exist. Changes to the reserve are charged as a current period expense.
Inventory, Seasonality, Inflation and General Economic Factors
The Company attempts to keep its inventory for its product at levels that will enable shipment against orders to be fulfilled on a timely basis. However, certain components must be inventoried well in advance of actual orders because of time-to-acquire circumstances. For the most part, purchases are based upon anticipated quarterly requirements, which are projected based upon sales indications, and general business factors. All of the Company’s contract manufactured products and components are purchased from non-affiliated entities. The Company outsources shipping and warehousing through a Casestack managed facility located outside of Scranton, Pennsylvania.
Sales of many of the Company’s products are not particularly seasonal, but sales of its sun-care and depilatory products usually peak during the spring and summer seasons. The Company does not have a product that can be identified as a ‘Christmas item’ and typically does not experience any sales peak during the holiday season.
The Company plans to continue to promote its sales through an advertising program consisting of a combination of media and co-op advertising. We continue to seek to decrease the amount of “on hand” inventory we stock; however to better service our customers we often find it difficult to reduce our “safety stock”.
Because the Company's products are sold to retail stores (throughout the United States and abroad), sales are particularly affected by general economic conditions. Accordingly, any adverse change in the economic climate in the U.S. or abroad can have an adverse impact on the Company’s sales and financial condition. The Company does
not believe that inflation or other general economic circumstances that would further negatively affect operations can be predicted at present, but if such circumstances should occur, they could have material and negative impact on the Company’s net sales and revenues, unless the Company was able to pass along related cost increases to its customers.
Contractual Obligations
The following table sets forth the contractual obligations as of November 30, 2017. Such obligations include the Company's debt, current lease for the Company’s premises, written employment contracts and License Agreements, less sub-lease rental income.
|
| | | | | | | | |
| Less than | | | More than |
| 1 Year | 1-3 Years | 3-5 Years | 5 years |
Leases on Premises (1) | $914,766 | $1,828,984 | $1,089,200 | $0 |
Employment Contracts (2) | 775,000 |
| 1,600,000 |
| 1,600,000 |
| 800,000 |
|
Other Operating Leases | 2,280 |
| 4,560 |
| 2,470 |
| — |
|
Capital Lease Obligations | 358 |
| — |
| — |
| — |
|
Open Purchase Orders (3) | 1,809,722 |
| — |
| — |
| — |
|
Total Contractual Obligations | $3,502,126 | $3,433,544 | $2,691,670 | $800,000 |
Sub-lease rental income (4) | $790,912 | $1,613,557 | $1,053,520 | $0 |
Net Contractual Obligations | $2,711,214 | $1,819,987 | $1,638,150 | $800,000 |
| |
(1) | The leases consist of a lease for the Company's office located in Lyndhurst, New Jersey, a lease for a former facility in Ridgefield Park, New Jersey and a lease for the Company's former facility located in East Rutherford, New Jersey. The Lyndhurst, New Jersey lease is for three years commencing December 15, 2017, with an annual rent cost of $34,145 for the first eighteen months of the lease and $35,020 for the second eighteen months of the lease. In addition the Company pays an electric charge of $1.75 per square foot per annum. The Ridgefield Park lease is a net lease requiring a yearly rental of $154,458, with annual increases over the term of the lease. Included in the annual rental cost is a charge of $1.75 per square foot per year for electric costs. The lease is for five years and four months, commencing April 10, 2015, and contains a provision for four months of rent at no charge. The East Rutherford lease is a net lease requiring a yearly rental of $503,676 plus Common Area Maintenance “CAM”, which is estimated at $205,938 per year and includes real estate taxes, common area expense, utility expense, repair and maintenance expense and insurance expense. See Part I, Item 2 for further information. The rental provided above is the base rental and estimated CAM. The lease has an annual CPI adjustment, not to cumulatively exceed 30% in any consecutive five year period. The Company signed a new lease for the premises beginning June 1, 2012 and expiring May 31, 2022, with a renewal option at fair market value for an additional five years. CAM has been estimated at $205,938 per year for future years beginning in fiscal 2017. |
| |
(2) | On March 21, 2011, the compensation committee of the Board of Directors, acting on behalf of the Company, entered into an Employment Agreement (the “Employment Agreement”) with Stephen A. Heit (“Executive”). Pursuant to the Employment Agreement Mr. Heit was engaged to continue to serve as the Company’s Executive Vice President and Chief Financial Officer. The initial term of employment under the Employment Agreement ran from March 21, 2011 through December 31, 2013, with successive one-year renewal terms thereafter unless the Company or the Executive chooses not to renew the Employment Agreement. The Employment Agreement was automatically renewed for 2018. Under the Employment Agreement, the base salary of Mr. Heit was established as $250,000 per annum, subject to annual increases at the discretion of the Company’s Board of Directors. Mr. Heit's base salary was increased to $300,000, effective January 15, 2018. The Executive is eligible to receive an annual performance-based bonus under his Employment Agreement, and is entitled to participate in Company equity compensation plans. In addition, the Executives receives an automobile allowance, health insurance and certain other benefits. In the event of termination of the Employment Agreement as a result of the disability or death of the Executive, the Executive (or his estate or beneficiaries) shall be entitled to receive all base salary and other benefits earned and accrued until such termination as well as a single-sum payment equal to the Executive’s base salary and a single-sum payment equal to the value of the highest bonus earned by the Executive in the one-year period preceding the date of termination pro-rated for the number of days |
served in that fiscal year. If the Company terminates the Executive for Cause (as defined in the Employment Agreement), or the Executive terminates his employment in a manner not considered to be for Good Reason, the Executive shall be entitled to receive all base salary and other benefits earned and accrued prior to the date of termination. If the Company terminates the Executive in a manner that is not for Cause or due to the Executive’s death or disability, the Executive terminates his employment for Good Reason, or the Company does not renew the Employment Agreement after December 31, 2013, the Executive shall be entitled to receive a single-sum payment equal to his unpaid base salary and other benefits earned and accrued prior to the date of termination and a single-sum payment of an amount equal to three times the average of the base salary amounts paid to Executive over the three calendar years prior to the date of termination. In addition, the Executive is entitled to certain benefits in connection with a Change of Control (as defined in his Employment Agreement). Under the Employment Agreement, the Executive agreed to non-competition restrictions for a period of six months following the end of the term of his Employment Agreement, during which period the Executive will be paid an amount equal to his base salary for a period of six months, and an amount equal to the pro rata share of any bonus attributable to the portion of the year completed prior to the date of termination. The Executive also agreed to confidentiality and non-solicitation restrictions under the Employment Agreement. The foregoing summary of the Employment Agreement is qualified in their entirety by the full text of the Employment Agreement, copies of which may be found in Form 8-K that was filed by Company on March 21, 2011 with the United States Securities and Exchange Commission. In April 2016, Douglas Haas was appointed President and Chief Operating Officer of the Company. He had been the Company's Executive Vice President - Operations. Mr. Haas' base salary was $275,000 per annum and was increased to $300,000 per annum effective January 15, 2008. On February 22, 2016, the Company and Mr. Haas (the "Employee") entered into a Severance Agreement. In the event of termination of the Employee's employment as a result of the disability or death of the Employee, the Employee (or his estate or beneficiaries) shall be entitled to receive all base salary and other benefits earned and accrued until such termination as well as a single-sum payment equal to the Employees’s base salary and a single-sum payment equal to the value of the highest bonus earned by the Employee in the one-year period preceding the date of termination pro-rated for the number of days served in that fiscal year. If the Company terminates the Employee for Cause (as defined in the Severance Agreement), or the Employee terminates his employment in a manner not considered to be for Good Reason (as defined in the Severance Agreement), the Employee shall be entitled to receive all base salary and other benefits earned and accrued prior to the date of termination. If the Company terminates the Employee in a manner that is not for Cause or due to the Employee’s death or disability or the Employee terminates his employment for Good Reason, the Employee shall be entitled to receive a single-sum payment equal to his unpaid base salary and other benefits earned and accrued prior to the date of termination and a single-sum payment of an amount equal to three times the average of the base salary amounts paid to Employee over the three calendar years prior to the date of termination. In addition, the Employee is entitled to certain benefits in connection with a Change of Control (as defined in the Severance Agreement). Under the Severance Agreement, the Employee has agreed to non-competition restrictions for a period of six months following the end of his employment, during which period the Employee will be paid an amount equal to his base salary for a period of six months, and an amount equal to the pro rata share of any bonus attributable to the portion of the year completed prior to the date of termination. The Employee has also agreed to confidentiality and non-solicitation restrictions under the Severance Agreement. The Company also entered into an Employment Agreement with another Company executive, who is not a “named executive officer” within the meaning of the Securities Exchange Act of 1934, as amended and related regulations. This additional Employment Agreement contains substantially similar terms as the agreement for Douglas Haas discussed above and provides for a base salary which is currently $200,000 per annum. The more than 5 years column only reflects one year of employment contract payments for Stephen Heit, Douglas Haas and the other employee who is not a named executive officer; the payments can continue in perpetuity so long as the Company does not terminate the Employment Agreement.
| |
(3) | Open purchase orders reflect purchase orders issued as of November 30, 2017. The Company has been increasing the purchase orders issued to give a longer term commitment to its contract manufacturers in order to ensure a more stable supply of product delivered on a timely basis. |
| |
(4) | Sub-lease rental income is for the sub-lease of the Company's former facilities at 65 Challenger Road, Suite 340, Ridgefield Park, New Jersey and 200 Murray Hill Parkway, East Rutherford, New Jersey. See Item 2 - Properties for further information regarding the sub-lease. |
Recent Accounting Pronouncements
In February 2016, the Financial Accounting Standards Board ("FASB") issued Accounting Standards Update No. 2016-02, Leases. The new standard establishes a right-of-use (ROU) model that requires a lessee to record a ROU asset and a lease liability on the balance sheet for all leases with terms longer than 12 months. Leases will be classified as either finance or operating, with classification affecting the pattern of expense recognition in the income statement. The new standard is effective for fiscal years beginning after December 15, 2018, including interim periods within those fiscal years. A modified retrospective transition approach is required for lessees for capital and operating leases existing at, or entered into after, the beginning of the earliest comparative period presented in the financial statements, with certain practical expedients available. While we are still evaluating the impact of our pending adoption of the new standard on our consolidated financial statements, we expect that upon adoption we will recognize ROU assets and lease liabilities and that the amounts could be material.
In November 2015, the FASB issued ASU 2015-17, which is an update to Topic 740, "Income Taxes". The update will require that all deferred tax assets and liabilities be classified as non-current. The update is effective for fiscal years, and the interim periods within those years, beginning after December 15, 2016. ASU 2015-17 will have a material impact on the Company's balance sheet, as the deferred tax reported as a current asset will be reported as a non-current asset once the update is effective, resulting in a decrease to the Company's current ratio. As of November 30, 2017, the Company reported $2,079,988 of deferred tax as a current asset. The Company will be reporting all deferred tax assets as a non-current asset beginning with the first quarter of fiscal 2018. It is not expected to have a material impact on the Company's results of operations.
In May 2014, the FASB issued ASU 2014-09, “Revenue from Contracts with Customers”. This new standard will replace most existing revenue recognition guidance in U.S. GAAP when it becomes effective. The underlying principle of this new standard is that an entity should recognize revenue to depict the transfer of promised goods or services to customers in an amount that reflects the consideration for which the entity expects to be entitled in exchange for those goods or services. Entities may adopt this new standard either retrospectively for all periods presented in the financial statements (i.e., the full retrospective method) or as a cumulative-effect adjustment as of the date of adoption (i.e., the modified retrospective method), without applying to comparative years’ financial statements. In August 2015, the FASB issued ASU No. 2015-14, “Revenue from Contracts with Customers: Deferral of the Effective Date,” which changed the effective date for implementation to annual reporting periods, including interim reporting periods within those periods, beginning after December 15, 2017. Early adoption is permitted as of annual reporting periods beginning after December 15, 2016, including interim reporting periods within those annual periods. The Company does not plan to adopt ASU 2014-09 until its 2019 fiscal year which begins on December 1, 2018. The Company is currently in the process of evaluating the impact that ASU No. 2014-09 will have on the Company’s results of operations, financial condition and financial statement disclosures and will provide further updates in future periods.
Management does not believe that any recently issued, but not yet effective, accounting standards if currently adopted would have a material effect on the accompanying financial statements.
Item 7A. QUANTITATIVE AND QUALITATIVE DISCLOSURE ABOUT MARKET RISK
The Company did not have any investments or marketable securities as of November 30, 2017.
Item 8. FINANCIAL STATEMENTS AND SUPPLEMENTARY DATA
The Financial Statements are listed under Item 15 in this Form 10-K. The following financial data is a summary of the quarterly results of operations (unaudited) during and for the years ended November 30, 2017 and 2016:
|
| | | | | | | | | | | | | | | | | |
| | | | Three Months Ended | | | |
Fiscal 2017 | | Feb. 28 | | May 31 | | Aug. 31 | | Nov 30 | |
Net Sales | | $ | 4,265,078 |
| | $ | 6,111,836 |
| | $ | 5,329,753 |
| | $ | 4,106,595 |
| |
Total Revenue | | 4,269,151 |
| | 6,115,910 |
| | 5,334,368 |
| | 4,110,669 |
| |
Cost of Sales | | 1,707,854 |
| | 2,345,980 |
| | 1,989,572 |
| | 1,404,370 |
| |
Gross Profit | | 2,557,224 |
| | 3,765,856 |
| | 3,340,181 |
| | 2,702,225 |
| |
Income from Continued Operations | | $ | 186,752 |
| | $ | 698,550 |
| | $ | 377,683 |
| | $ | 568,196 |
| |
(Loss) Income from Discontinued Operations | | — |
| | — |
| | — |
| | — |
| |
Net Income | | $ | 186,752 |
| | $ | 698,550 |
| | $ | 377,683 |
| | $ | 568,196 |
| |
Earnings Per Share: | | | | | | | | | |
Basic | | | | | | | | | |
Continuing Operations | | $ | 0.03 |
| | $ | 0.10 |
| | $ | 0.05 |
| | $ | 0.08 |
| |
Discontinued Operations | | $ | — |
| | $ | — |
| | $ | — |
| | $ | — |
| |
Total earnings per share | | $ | 0.03 |
| | $ | 0.10 |
| | $ | 0.05 |
| | $ | 0.08 |
| |
Diluted | | | | | | | | | |
Continuing Operations | | $ | 0.03 |
| | $ | 0.10 |
| | $ | 0.05 |
| | $ | 0.08 |
| |
Discontinued Operations | | $ | — |
| | $ | — |
| | $ | — |
| | $ | — |
| |
Total earnings per share | | $ | 0.03 |
| | $ | 0.10 |
| | $ | 0.05 |
| | $ | 0.08 |
| |
|
| | | | | | | | | | | | | | | | | |
| | | | Three Months Ended | | | |
Fiscal 2016 | | Feb. 28 | | May 31 | | Aug. 31 | | Nov. 30 | |
Net Sales | | $ | 4,680,272 |
| | $ | 5,675,177 |
| | $ | 5,036,658 |
| | $ | 4,218,127 |
| |
Total Revenue | | 4,684,444 |
| | 5,679,751 |
| | 5,041,193 |
| | 4,223,356 |
| |
Cost of Sales | | 1,814,794 |
| | 2,122,059 |
| | 2,309,056 |
| | 1,912,190 |
| |
Gross Profit | | 2,865,478 |
| | 3,553,118 |
| | 2,727,602 |
| | 2,305,937 |
| |
Income from Continued Operations | | $ | 208,940 |
| | $ | 430,989 |
| | $ | 321,367 |
| | $ | 231,388 |
| |
(Loss) Income from Discontinued Operations | | (5,571 | ) | | (7,312 | ) | | — |
| | 1,409 |
| |
Net Income | | $ | 203,369 |
| | $ | 423,677 |
| | $ | 321,367 |
| | $ | 232,797 |
| |
Earnings Per Share: | | | | | | | | | |
Basic | | | | | | | | | |
Continuing Operations | | $ | 0.03 |
| | $ | 0.06 |
| | $ | 0.05 |
| | $ | 0.03 |
| |
Discontinued Operations | | $ | — |
| | $ | — |
| | $ | — |
| | $ | — |
| |
Total earnings per share | | $ | 0.03 |
| | $ | 0.06 |
| | $ | 0.05 |
| | $ | 0.03 |
| |
Diluted | | | | | | | | | |
Continuing Operations | | $ | 0.03 |
| | $ | 0.06 |
| | $ | 0.05 |
| | $ | 0.03 |
| |
Discontinued Operations | | $ | — |
| | $ | — |
| | $ | — |
| | $ | — |
| |
Total earnings per share | | $ | 0.03 |
| | $ | 0.06 |
| | $ | 0.05 |
| | $ | 0.03 |
| |
The Company discontinued the Gel Perfect nail polish brand in fiscal 2014 which is reported as discontinued operations in the statement of operations for the each of the quarters in fiscal 2016.
Item 9. CHANGES IN AND DISAGREEMENTS WITH ACCOUNTANTS ON ACCOUNTING AND FINANCIAL DISCLOSURE
During the Company’s fiscal years ended November 30, 2017, 2016, and 2015 there were (i) no disagreements between the Registrant and the Company's independent registered public accounting firm, BDO USA LLP, on any matter of accounting principles or practices, financial statement disclosures or auditing scope or procedure, which, if not resolved to the satisfaction of BDO USA LLP would have caused BDO USA LLP to make reference thereto in their reports on the financial statements for such years, and (ii) no “reportable events” as that term is defined in Item 304(a)(1)(v) of Regulation S-K.
Item 9A. CONTROLS AND PROCEDURES
Under Section 404 of the Sarbanes-Oxley Act of 2002, the Company’s fiscal 2017 annual report is required to be accompanied by a “Section 404 Formal Report” by management on the effectiveness of internal controls over financial reporting. The Company’s officers evaluate and confirm the effectiveness of the Company’s internal controls over financial reporting, that the Company’s data processing software systems and other procedures are effective and that the information created by the Company’s systems adequately confirm the validity of the information upon which the Company relies.
The Company regularly reviews the effectiveness of its internal controls and procedures, including financial reporting. It works to strengthen its procedures wherever necessary.
The Company has established disclosure controls and procedures designed to provide reasonable assurance that information required to be disclosed in the reports that the Company files or submits under the Securities Exchange Act of 1934, as amended (the “Exchange Act”) is recorded, processed, summarized and reported within the time periods specified in the SEC’s rules and forms and is accumulated and communicated to management, including the principal executive officer (our Chief Executive Officer) and principal financial officer (our Chief Financial Officer), to allow timely decisions regarding required disclosure. Notwithstanding the foregoing, there can be no assurance that the Company’s disclosure controls and procedures will detect or uncover all failures of persons within the Company to disclose material information otherwise required to be set forth in the Company’s periodic reports. There are inherent limitations to the effectiveness of any system of disclosure controls and procedures, including the possibility of human error and the circumvention or overriding of the controls and procedures. Accordingly, even effective disclosure controls and procedures can only provide reasonable, not absolute, assurance of achieving their control objectives.
An evaluation was performed under the supervision of the Company’s management, including the Chief Executive Officer and Chief Financial Officer, of the effectiveness of the design and operation of the Company’s disclosure controls and procedures (as defined in the Exchange Act Rules 13a-15(e) and 15d-15(e)) as of the end of the period covered by this report. Based on that evaluation, the Company’s management, including the Chief Executive Officer and Chief Financial Officer, concluded that, as of November 30, 2017, the Company’s disclosure controls and procedures were effective at the reasonable assurance level to ensure that information we are required to disclose in reports that we file or submit under the Exchange Act is recorded, processed, summarized and reported within the time periods specified in the Commission’s rules and forms, and is accumulated and communicated to our management, including the Chief Executive Officer and Chief Financial Officer, as appropriate, to allow timely decisions regarding required disclosure.
This annual report does not include an attestation report of the Company’s independent registered public accounting firm regarding internal control over financial reporting. Management’s report was not subject to attestation by the Company’s independent registered public accounting firm pursuant to rules of the SEC that pertain to smaller reporting companies, and permit the Company to provide only management’s report in this annual report.
Management’s Report on Internal Control Over Financial Reporting
Under Section 404 of the Sarbanes-Oxley Act of 2002, our management, including our Chief Executive Officer and Chief Financial Officer, are required to assess the effectiveness of the Company’s internal control over
financial reporting as of November 30, 2017 and report, based on that assessment, whether the Company’s internal control over financial reporting was effective.
Management of the Company is responsible for establishing and maintaining adequate internal control over financial reporting, as defined in Rules 13a-15(f) or 15d-15(f) under the Securities Exchange Act of 1934. The Company’s internal control over financial reporting is a process designed by, or under the supervision of, our Chief Executive Officer and Chief Financial Officer to provide reasonable assurance regarding the reliability of the Company’s financial reporting and the preparation of financial statements for external purposes in accordance with generally accepted accounting principles.
The Company’s internal control over financial reporting includes those policies and procedures that: (i) pertain to the maintenance of records that, in reasonable detail, accurately and fairly reflect the transactions and dispositions of the assets of the Company; (ii) provide reasonable assurance that transactions are recorded as necessary to permit preparation of financial statements in accordance with generally accepted accounting principles, and that receipts and expenditures of the Company are being made only in accordance with authorizations of management and directors of the Company; and (iii) provide reasonable assurance regarding prevention or timely detection of unauthorized acquisition, use or disposition of the Company’s assets that could have a material effect on the financial statements.
Internal control over reporting, because of its inherent limitations, may not prevent or detect misstatements. Projections of any evaluation of effectiveness for future periods are subject to the risk that controls may become inadequate because of changes in conditions, or that the degree of compliance with the policies or procedures may deteriorate.
The Company’s management has assessed the effectiveness of its internal control over financial reporting as of November 30, 2017 using the criteria as set forth in Internal Control – Integrated Framework by the Committee of Sponsoring Organizations of the Treadway Commission (2013 framework). The Company’s assessment included documenting, evaluating and testing of the design and operating effectiveness of its internal control over financial reporting. Management of the Company has reviewed the results with the Audit Committee of the Board of Directors.
Based on the Company’s assessment, management has concluded that, as of November 30, 2017, the Company’s internal control over financial reporting was effective.
/s/ LANCE FUNSTON
Lance Funston, Chief Executive Officer
/s/ STEPHEN A. HEIT
Stephen A. Heit, Chief Financial Officer
Changes in Internal Control over Financial Reporting
No changes in the Company’s internal control over financial reporting (as defined in Rules 13a-15(f) and 15d-15(f) under the Exchange Act) occurred during the fiscal quarter ended November 30, 2017 that have materially affected, or are reasonably likely to materially affect, the Company’s internal control over financial reporting.
ITEM 9B. OTHER INFORMATION
None
PART III
Item 10. DIRECTORS, EXECUTIVE OFFICERS AND CORPORATE GOVERNANCE
The Executive Officers and Directors of the Company are as follows:
|
| | | | |
| | | | |
NAME | | POSITION | | YEAR OF FIRST COMPANY SERVICE |
| | |
Lance T. Funston | | Chairman of the Board of Directors and Chief Executive Officer | | 2015 |
Douglas Haas | | President and Chief Operating Officer | | 2015 |
Stephen A. Heit | | Chief Financial Officer, Treasurer and Director | | 2005 |
Sardar Biglari | | Director | | 2011 |
Philip Cooley | | Director | | 2011 |
S. David Fineman | | Director | | 2015 |
Christopher Hogg | | Director | | 2015 |
Justin W. Mills, III | | Director (appointed September 28, 2017) | | 2017 |
Lance T. Funston, 75 years old is the Company's Chairman of the Board and Chief Executive Officer. Mr. Funston also serves as Chairman and CEO of Ultimark Products, LLC which he founded in 2000. The consumer products company manufactures and distributes Porcelana®. In 1993 he founded TelAmerica Media, a media aggregator. In 2008, 85% of TelAmerica Media was sold to Cross MediaWorks, Inc., the balance was sold to the Lee Group in 2013. Mr. Funston attended the University of Houston and received his Bachelor of Science degree in 1967. In 1967, Mr. Funston was appointed Assistant to the Director of the Federal Deposit Insurance Corporation by President Lyndon Johnson, and subsequently as special assistant to a governor of the Federal Reserve Board. Mr. Funston attended Harvard Business School, receiving his MBA in 1970. During his tenure at Harvard, he founded Portfolio Management Systems Incorporated, which developed investment management systems for major financial institutions including: John Hancock, Fidelity Mutual, American General, Sun Life, and Bank of America. In 1973 Portfolio Management created a private real estate equity fund in Houston, Texas and developed residential and commercial properties during a 10 year period. He also served as a board member of the United States Bobsled and Skeleton Federation from 1992 to 1996. In 2007, Lance and his wife, Christina, founded the Save a Mind Foundation, a 501(c)3 federal non-profit organization that assists at-risk youth in grades 5-8 to stay in school with their innovative Win/Win Program.
Director Qualifications
| |
• | Extensive experience in the consumer products market segment |
| |
• | Substantial experience in television advertising |
| |
• | Demonstrated leadership of numerous companies and organizations |
Douglas Haas, 51 years old, is the Company's President and Chief Operating Officer. Prior to this appointment, Mr. Haas served as the Company's Executive Vice President - Operations. Mr. Haas was formerly President and Chief Operating Officer of Ultimark Products, Inc. which he joined in 2004. Ultimark Products is a consumer products company that manufactures and distributes Porcelana®. Lance Funston, who is the Company’s Chairman of the Board and Chief Executive Officer is also Chairman of the Board and Chief Executive Officer of Ultimark. Mr. Haas has spent over 25 years working for specialty manufacturing companies in many different key roles.
Stephen A. Heit, 63 years old, joined CCA in May 2005 as Executive Vice President – Operations, and was appointed Chief Financial Officer in March 2006. Mr. Heit has also served a Director since 2014. Prior to joining CCA, Mr. Heit was Vice President – Business Strategies for Del Laboratories, Inc., a consumer products company that was listed on the American Stock Exchange, from 2003 to 2005. Mr. Heit served as President of AM Cosmetics, Inc. from 2001 to 2003 and as Chief Financial Officer from 1998 to 2003. From 1986 to 1997 he was the Chief Financial Officer of Pavion Limited, and also served on the Board of Directors. He served as a Director of Loeb House, Inc., a non-profit organization serving mentally handicapped adults from 1987 to 1995, and Director of Nyack Hospital Foundation from 1993 to 1995. He received a Bachelor of Science from Dominican College in 1976, with additional graduate work in Professional Accounting at Fordham University, and received an MBA in accounting from the University of Connecticut Graduate Business School.
Director Qualifications
| |
• | Extensive leadership experience in consumer products companies |
| |
• | Previous experience serving on the board of directors of a consumer products company |
| |
• | Substantial financial experience |
Sardar Biglari, 40 years old, is a director of the Company from August 2011 to July 2014 and since October 2015. He is Founder, Chairman and Chief Executive Officer of Biglari Holdings Inc. (“Biglari Holdings”), a diversified holding company. Mr. Biglari is also sole owner, Chairman and Chief Executive Officer of Biglari Capital Corp., general partner of The Lion Fund, L.P. and The Lion Fund II, L.P., private investment partnerships, since its inception in 2000. He has also served as a director of Insignia Systems, Inc. ("Insignia Systems"), a developer and marketer of point-of-purchase in-store products and services, from December 2015 to March 2017, including serving as its Co-Chairman from January 2016 to March 2017. On November 14, 2014, Lance T. Funston entered into an agreement with The Lion Fund, L.P. and, for certain limited purposes, Sardar Biglari and Philip L. Cooley (the “Agreement”). The Agreement provided that if the Company’s Board of Directors nominates Messrs. Biglari and Cooley to the Board, they will accept the nomination and serve on the Board upon their election. See footnote 6 to the beneficial ownership table below under Item 12 for additional information regarding the Agreement.
Director Qualifications
| |
• | Mr. Biglari has extensive managerial and investing experience in a broad range of businesses. |
| |
• | Experience serving on the board of directors of public companies. |
| |
• | Deemed by the Board of Directors to be an "audit committee financial expert" as defined by the SEC rules and "financially sophisticated" as defined by the NYSE American rules. |
Philip L. Cooley, 74 years old, is a director of the Company from August 2011 to July 2014 and since October 2015. He has served as Vice Chairman of the Board of Biglari Holdings since April 2009 and as a director since March 2008. He was the Prassel Distinguished Professor of Business at Trinity University, San Antonio, Texas, from 1985 until his retirement in May 2012. Dr. Cooley served as an advisory director of Biglari Capital Corp., general partner of The Lion Fund, L.P. and The Lion Fund II, L.P, since 2000 and as Vice Chairman and a director of Western Sizzlin Corporation from March 2006 and December 2005, respectively, until its acquisition by Biglari Holdings in March 2010. He also served as a director of Insignia Systems from December 2015 to March 2017. Dr. Cooley earned a Ph.D. from Ohio State University, a MBA from the University of Hawaii and a BME from the General Motors Institute. Dr. Cooley is past president of the Eastern Finance Association, and serves on its board, and of the Southern Finance Association. He also serves on the board of the Financial Literacy of South Texas Foundation. On November 14, 2014, Lance T. Funston entered into an agreement with The Lion Fund, L.P. and, for certain limited purposes, Sardar Biglari and Philip L. Cooley (the “Agreement”). The Agreement provided that if the Company’s Board of Directors nominates Messrs. Biglari and Cooley to the Board, they will accept the nomination and serve on the Board upon their election. See footnote 6 to the beneficial ownership table below under Item 12 for additional information regarding the Agreement.
Director Qualifications
| |
• | Dr. Cooley has extensive business and investment knowledge and experience. |
| |
• | Experience serving on the boards of directors of public companies. |
| |
• | Author of more than 60 articles on financial topics, his work has appeared in the Journal of Finance, Journal of Business and others. He also has authored several books in finance. |
| |
• | Deemed by the Board of Directors to be an "audit committee financial expert" as defined by the SEC rules and "financially sophisticated" as defined by the NYSE American rules. |
S. David Fineman, 72 years old, is a senior partner of the Philadelphia law firm of Fineman Krekstein & Harris. He was the Chairman of the Public Policy Committee of the Urban Land Institute and continues to be a member. Mr. Fineman was appointed by the President of the United States and confirmed by the United States Senate in 1995 as one of nine Governors of the U.S. Postal Service and was Chairman of the Board of Governors from 2003 to 2005. He has served since 2010 as Chairman of the Board of DHL eCommerce USA, a wholly owned subsidiary of Deutsche Post, the largest mail consolidator of small parcels in the United States. He has been chosen by the United States District Court as a member of its Court-Annexed Early Mediation Program (from 1998 to present). In 2006 through 2014, Mr. Fineman was recognized among his peers and was named as one of Pennsylvania “Super Lawyers” for his expertise in Business Litigation and Government Relations. He graduated from The American University (1967) where he presently serves on the Advisory Committee to the School of Public Affairs, and received his law degree, with Honors, from The George Washington University (1970). He is presently a member of the Philadelphia, Pennsylvania and American Bar Associations and the Urban Land Institute.
Director Qualifications
| |
• | Mr. Fineman has extensive legal experience as senior partner of a law firm. |
| |
• | Substantial corporate governance knowledge as Chairman of the Board of DHL eCommerce USA. |
| |
• | Deemed by the Board of Directors to be an "audit committee financial expert" as defined by the SEC rules and "financially sophisticated" as defined by the NYSE American rules. |
Christopher Hogg, 59 years old, has been the entrepreneurial prime mover behind a number of businesses in the consumer financial services industry. Chris is an Australian citizen and resides in the United States in Pennsylvania. His experience is based in the corporate insurance, consumer debt recovery, retail financial services, payroll and payments transaction services and consumer finance industries. He is the founder of EmployeeCash, a unique digital workplace consumer loans platform. Chris is Chairman of a National Surety Underwriters and National Fidelity Reinsurance Company founded in 2014, underwriting Surety Guarantee and Contract Bonding business throughout the USA. Chris, through Broad Street Global LLC recently acquired NJ based debt collection and receivables management company SRA Associates LLC, NY based debt collection company North Shore Agency and a CA based Auto Loans business.
Director Qualifications
| |
• | Extensive experience in the digital media and technology business |
| |
• | Leadership role in publicly held company |
Justin W. Mills III, 69 years old, was president of the Philadelphia and Southern New Jersey region of PNC, a member of The PNC Financial Services Group, from 2001 to 2014. Mr. Mills was promoted to executive vice president in 1993 in charge of Capital Markets and chaired the Asset Liability Committee. Following that assignment, he was executive vice president managing PNC Wealth Management in Philadelphia and Southern New Jersey. Mr. Mills is active in the Philadelphia and Southern New Jersey community, serving as Vice Chairman of the board of directors of Independence Blue Cross, and at Temple University as Chair of the Athletic Committee and member of the Executive Committee, Audit and Investment Committees. He also serves on the board of The United Way of Southeastern Pennsylvania, and co-chairs the Corporate Board of the Barnes Foundation. He holds a master’s in economics from Niagara University, a bachelor’s in mathematics from Ohio State University and is a graduate of the University of Illinois School of Bank Investments.
Director Qualifications
| |
• | Banking and corporate lending expertise |
| |
• | Board oversight and governance experience |
| |
• | Deemed by the Board of Directors to be an "audit committee financial expert" as defined by the SEC rules and "financially sophisticated" as defined by the NYSE American rules |
Committees of the Board of Directors
The Board of Directors has established three committees. The audit committee is comprised solely of independent directors, Philip Cooley, who serves as its’ Chairman, S. David Fineman and William J. Mills, III. Directors Cooley, Fineman and Mills each qualify as an “audit committee financial expert” as defined by the SEC, are “independent” as that term is used in Section 10(m)(3) of the Exchange Act and NYSE-American rules and are “financially sophisticated” as defined by NYSE-American rules. The compensation committee is comprised of Philip Cooley, S. David Fineman and Christopher Hogg. Each member of the compensation committee is “independent” as defined by NYSE-American rules. The nominating committee is comprised of Philip Cooley, Christopher Hogg and S. David Fineman.
Section 16(a) Beneficial Ownership Reporting Compliance
Section 16(a) of the Securities Exchange Act of 1934 requires our executive officers and directors and beneficial owners of more than ten percent of the Company’s Common Stock to file reports regarding ownership of the Company’s Common Stock with the SEC, and to furnish the Company with copies of all such filings. Based solely on a review of these filings, the Company believes that all filings were timely made in fiscal 2017 except for two late Forms 4 filed by Douglas Haas, President and Chief Operating Officer on February 28, 2017 and July 14, 2017, two late Forms 4 filed by Stephen Heit, Chief Financial Officer, on February 28, 2017 and July 14, 2017, a late Form 4 filed by Lance Funston, Chairman of the Board and Chief Executive Officer on July 17, 2017, and a late Form 3 and Form 4 filed by Justin W. Mills, a director of the Company, on October 5, 2017.
Code of Ethics
The Company had adopted Standards of Business Conduct (our code of ethics), which apply to all directors and employees of the Company, including the Chief Executive Officer and Chief Financial Officer. A copy of the Standard of Business Conduct may be found in the investor section of the Company’s web site, www.ccaindustries.com, under Corporate Governance. The Company intends to disclose any substantive amendments to the Standards of Business Conduct as well as any waivers from provisions such document made with respect to our Chief Executive Officer, Chief Financial Officer, any principal accounting officer, and any other executive officer or any director at the same web site location. A print copy of our Standards of Business Conduct will be provided to any person upon request and without charge by writing to the following address: CCA Industries Inc., 1099 Wall Street West, Suite 275, Lyndhurst, NJ 07031, Attention: Corporate Secretary.
Item 11. EXECUTIVE COMPENSATION
i. Summary Compensation Table
The following table summarizes compensation earned in the 2017, 2016 and 2015 fiscal years by the following named officers:
|
| | | | | | | | | | | | | | | | | |
Name and Principal Position | | Year | | Salary ($) | | Bonus ($) (1) | | Option Awards ($) (2) | | All Other Compensation ($) (3) | | Total ($) |
Lance T. Funston, | | 2017 | | 385,000 |
| | 114,728 |
| | 119,168 |
| | 23,147 |
| | 642,043 |
|
Chief Executive Officer (4) | | 2016 | | 306,731 |
| | 88,853 |
| | | | — |
| | 395,584 |
|
| | 2015 | | — |
| | — |
| | | | — |
| | — |
|
| | | | | | | | | | | | |
Stephen A. Heit, | | 2017 | | 280,000 |
| | 82,694 |
| | 55,612 |
| | 58,547 |
| | 476,853 |
|
Chief Financial Officer | | 2016 | | 280,000 |
| | 64,044 |
| | 54,628 |
| | 44,798 |
| | 443,470 |
|
and Executive Vice President | | 2015 | | 292,014 |
| | — |
| | 59,567 |
| | 39,518 |
| | 391,099 |
|
| | | | | | | | | | | | |
Douglas Haas, | | 2017 | | 275,000 |
| | 82,694 |
| | 79,445 |
| | 33,002 |
| | 470,141 |
|
President and | | 2016 | | 250,000 |
| | 64,044 |
| | 78,040 |
| | 21,992 |
| | 414,076 |
|
Chief Operating Officer (5) | | 2015 | | 48,008 |
| | — |
| | 15,418 |
| | — |
| | 63,426 |
|
| | | | | | | | | | | | |
| |
(1) | Bonus amounts represent amounts earned in each respective fiscal year, not necessarily paid in each year. |
| |
(2) | Represents the Company's grant date of the fair value of the stock options granted during each year computed in accordance with FASB ASC Topic 718. See Financial Statements Note 16 - Stock-Based Compensation for further information. |
| |
(3) | Includes Company automobile allowance, the value of Company-provided health insurance that is made available to all employees and Company contributions to the employees 401K account that is available to all eligible employees. Please see Item. 11, Section v.—Employment Contracts/Compensation Program for further information regarding the compensation of Stephen A. Heit, Lance T. Funston and Douglas Haas. Please see Note 9 to the financial statements for further information on the Company's 401K plan. |
| |
(4) | Lance Funston was appointed by the Board of Directors as Chief Executive Officer in January 2016 at a base salary of $350,000 per annum. |
| |
(5) | Douglas Haas was appointed President and Chief Operating Officer in January 2016. Mr. Haas was previously serving as Executive Vice President - Operations. |
ii. Outstanding Management Equity Awards at 2017 Fiscal Year End
The following table summarizes the outstanding equity awards granted to each of the name executive officers listed in the summary compensation table:
|
| | | | | | | | | |
Name and Principal Position | Number of securities underlying unexercised options (#) exercisable | Number of securities underlying unexercised options (#) unexercisable | | Option Exercise Price | Option Expiration Date |
Lance T. Funston, Chief Executive Officer | — |
| 75,000 |
| (1 | ) | 3.30 |
| 6/19/2027 |
Stephen A. Heit, Chief Financial Officer and Executive Vice President | — |
| 35,000 |
| (1 | ) | 3.30 |
| 6/19/2027 |
| 7,000 |
| 28,000 |
| (2 | ) | 3.35 |
| 6/21/2026 |
| 14,000 |
| 21,000 |
| (3 | ) | 3.48 |
| 1/4/2025 |
Douglas Haas, President and Chief Operating Officer | — |
| 50,000 |
| (1 | ) | 3.30 |
| 6/19/2027 |
| 10,000 |
| 40,000 |
| (2 | ) | 3.35 |
| 6/21/2026 |
| 4,000 |
| 6,000 |
| (4 | ) | 3.18 |
| 4/8/2025 |
(1) Options vest in equal 20% increments beginning one year after the date of grant, June 20, 2017.
(2) Options vest in equal 20% increments beginning one year after the date of grant, June 22, 2016.
(3) Options vest in equal 20% increments beginning one year after the date of grant, January 5, 2015.
(4) Options vest in equal 20% increments beginning one year after the date of grant, April 9, 2015.
There were no other stock options for named executive officers granted or options exercised during fiscal 2017.
iii. Compensation of Directors
The following table reports the fees earned or paid in cash and the fair market value of equity awards granted to each director, with respect to their service as directors, during fiscal 2017. Our non-employee directors received no other compensation in fiscal 2017.
|
| | | | | | | | | |
| | | |
Director (1) | Director Fees Earned or Paid in Cash | Fair Market Value of Option Awards | Total Compensation |
Sardar Biglari | $ | 11,000 |
| $ | — |
| $ | 11,000 |
|
Philip Cooley | 11,500 |
| — |
| 11,500 |
|
S. David Fineman | 15,500 |
| — |
| 15,500 |
|
Christopher Hogg | 15,500 |
| — |
| 15,500 |
|
Justin W. Mills, III (appointed September 28, 2017) | 3,833 |
| 83,813 |
| 87,646 |
|
Linda Shein (resigned September 7, 2017) | 9,500 |
| — |
| 9,500 |
|
(1) Each director held 75,000 unexercised options at November 30, 2017. All options held by directors had vested as of November 30, 2017 except for Justin W. Mills, III, whose options will not vest until October 1, 2018.
Effective June 2017, the Board of Directors approved the following fees: Chairman of the Audit, Compensation and Nominating Committees - $500 retainer per annum in addition to other director fees; Non-executive directors - $20,000 annual retainer to be paid quarterly in arrears, $500 per in-person board meeting and $250 for attendance by telephone. The Board of Directors met three times in person during fiscal 2017 for an aggregate compensation of $66,833. Mr. Funston and Mr. Heit do not receive any additional compensation as directors as they are employees of the Company.
iv. Executive Compensation Principles—Compensation Committee
The Company’s Executive Compensation Program is based on guiding principles designed to align executive compensation with Company values and objectives, business strategy, management initiatives, and financial performance. In applying these principles the Compensation Committee of the Board of Directors, comprised of Philip Cooley , S. David Fineman and Christopher Hogg has established a program to:
•Reward executives for long-term strategic management and the enhancement of shareholder value.
•Integrate compensation programs with both the Company’s annual and long-term strategic planning.
•Support a performance-oriented environment that rewards performance not only with respect to Company goals but also Company performance as compared to industry performance levels.
The Compensation Committee has a charter, which may be found in the investor section of the Company’s web site, www.ccaindustries.com under Corporate Governance. Compensation, including annual bonus amounts, for the executive officers named in the Summary Compensation Table (other than the Chief Executive Officer), are recommended by the Chief Executive Officer, and approved by the Compensation Committee and the Board of Directors.
v. Employment Contracts/Compensation Program
The Compensation Committee (the “Committee”) determines the level of salary and bonuses, if any, for key executive officers of the Company. The Committee determines the salary or salary range based upon competitive norms. Actual salary changes are based upon performance, and bonuses, if any, are awarded by the Committee and approved by the independent directors of the board in consideration of the employee’s performance during the fiscal year and, except for the Company’s Chief Executive Officer, upon the recommendation of the Company’s Chief Executive Officer.
On March 21, 2011, the Committee, acting on behalf of the Company, entered into an Employment Agreement (the “Employment Agreement”) with Stephen A. Heit (the “Executive”). Pursuant to his Employment Agreement, the Executive was engaged to continue to serve as the Company’s Executive Vice President and Chief Financial Officer. The Executive's contract was automatically renewed for fiscal 2018.
Under the Employment Agreement the base salary of the Executive is $250,000 per annum, and may be increased each year at the discretion of the Company’s Board of Directors. The Executive's base salary was increased to $300,000 per annum effective January 15, 2018. The Executive is eligible to receive an annual performance-based bonus under his Employment Agreement, and entitled to participate in Company equity compensation plans. In addition, the Executive will receive an automobile allowance, health insurance and certain other benefits. In the event of termination of the Employment Agreement as a result of the disability or death of the Executive, the Executive (or his estate or beneficiaries) shall be entitled to receive all base salary and other benefits earned and accrued until such termination as well as a single-sum payment equal to the Executive’s base salary and a single-sum payment equal to the value of the highest bonus earned by the Executive in the one-year period preceding the date of termination pro-rated for the number of days served in that fiscal year. If the Company terminates the Executive for Cause (as defined in the Employment Agreement), or the Executive terminates his employment in a manner not considered to be for Good Reason (as defined in the Employment Agreement), the Executive shall be entitled to receive all base salary and other benefits earned and accrued prior to the date of termination. If the Company terminates the Executive in a manner that is not for Cause or due to the Executive’s death or disability, the Executive terminates his employment for Good Reason, or the Company does not renew the Employment Agreement after December 31, 2013, the Executive shall be entitled to receive a single-sum payment equal to his unpaid base salary and other benefits earned and accrued prior to the date of termination and a single-sum payment of an amount equal to three times the average of the base salary amounts paid to Executive over the three calendar years prior to the date of termination. In addition, the Executive is entitled to certain benefits in connection with a Change of Control (as defined in the Employment Agreement).
Under the Employment Agreement, the Executive has agreed to non-competition restrictions for a period of six months following the end of the term of his Employment Agreement, during which period the Executive will be paid an amount equal to his base salary for a period of six months, and an amount equal to the pro rata share of any bonus attributable to the portion of the year completed prior to the date of termination. The Executive has also agreed to confidentiality and non-solicitation restrictions under the Employment Agreements.
The foregoing summary of the Employment Agreements is qualified in its entirety by the full text of the Employment Agreement, a copy of which may be found in Form 8-K that was filed by Company on March 21, 2011 with the United States Securities and Exchange Commission.
In January 2016, Lance Funston was appointed Chief Executive Officer of the Company in addition to his responsibilities as Chairman of the Board. Mr. Funston's base salary was $385,000 per annum and was increased to $450,000 per annum effective January 15, 2018. There is no written employment agreement between the Company and Mr. Funston.
In April 2016, Douglas Haas was appointed President and Chief Operating Officer of the Company. He had been the Company's Executive Vice President - Operations. Mr. Haas' base salary was $275,000 per annum and was increased to $300,000 per annum effective January 15, 2008. On February 22, 2016, the Company and Mr. Haas entered into a Severance Agreement. In the event of termination of the Employee's employment as a result of the disability or death of the Employee, the Employee (or his estate or beneficiaries) shall be entitled to receive all base salary and other benefits earned and accrued until such termination as well as a single-sum payment equal to the Employees’s base salary and a single-sum payment equal to the value of the highest bonus earned by the Employee
in the one-year period preceding the date of termination pro-rated for the number of days served in that fiscal year. If the Company terminates the Employee for Cause (as defined in the Severance Agreement), or the Employee terminates his employment in a manner not considered to be for Good Reason (as defined in the Severance Agreement), the Employee shall be entitled to receive all base salary and other benefits earned and accrued prior to the date of termination. If the Company terminates the Employee in a manner that is not for Cause or due to the Employee’s death or disability or the Employee terminates his employment for Good Reason, the Employee shall be entitled to receive a single-sum payment equal to his unpaid base salary and other benefits earned and accrued prior to the date of termination and a single-sum payment of an amount equal to three times the average of the base salary amounts paid to Employee over the three calendar years prior to the date of termination. In addition, the Employee is entitled to certain benefits in connection with a Change of Control (as defined in the Severance Agreement).
Under the Severance Agreement, the Employee has agreed to non-competition restrictions for a period of six months following the end of his employment, during which period the Employee will be paid an amount equal to his base salary for a period of six months, and an amount equal to the pro rata share of any bonus attributable to the portion of the year completed prior to the date of termination. The Employee has also agreed to confidentiality and non-solicitation restrictions under the Severance Agreement.
vi. Retirement Benefits
The Company has adopted a 401(K) Profit Sharing Plan that covers all employees with over six months of service and attained age 21, including the executive officers named in the Summary Compensation Table. Employees may make salary reduction contributions up to twenty-five percent of compensation not to exceed the federal government limits. The Plan allows for the Company to make discretionary contributions. The Company in fiscal 2017 began matching the employee contribution up to 3% of their pay. The Company made the following contributions during the 2017, 2016 and 2015 fiscal years:
|
| | | | | | | | | |
| November 30, |
| 2017 | 2016 | 2015 |
Company Contributions | $ | 26,241 |
| $ | — |
| $ | — |
|
vii. Equity Plans
Long-term incentives may be provided through the issuance of stock options or other equity awards, as determined in the discretion of the Board of Directors or compensation committee.
On June 15, 2005, the shareholders approved an amended and Restated Stock Option Plan amending the 2003 Stock Option Plan (the “2005 Plan”). The 2005 Plan authorizes the issuance of up to one million shares of common stock (subject to customary adjustments set forth in the 2005 Plan) pursuant to equity awards, which may take the form of incentive stock options, nonqualified stock options restricted shares, stock appreciation rights and/or performance shares. The 2005 Plan expired in April, 2015, but awards made under the 2005 Plan prior to its expiration will remain in effect until such awards have been satisfied or terminated in accordance with the terms and provisions of the 2005 Plan. On August 13, 2015, the shareholders approved the 2015 CCA Industries, Inc. Incentive Plan(the "2015 Plan" and together with the 2005 Plan, the "Plans"). The 2015 Plan authorizes the issuance of up to 700,000 shares of common stock plus any shares underlying outstanding awards under the 2005 Plan that terminate or expire unexercised or are canceled or forfeited (subject to customary adjustments set forth in the 2005 Plan) pursuant to equity awards, which may take the form of incentive stock options, nonqualified stock options, stock appreciation rights, restricted stock, restricted stock units, performance shares and/or cash award. On June 7, 2017, the shareholders approved the 2015 CCA Industries, Inc. Incentive Plan as Amended. The sole purpose of the amendment was to increase the shares available for issuance under the 2015 Plan from 700,000 to 1,400,000.
On June 20, 2017, the Company granted incentive stock options for an aggregate of 232,500 shares to ten employees at $3.30 per share, which was the closing price of the Company's stock on that day. The options vest in equal 20% increments beginning one year after the date of grant, and for each of the four subsequent anniversaries of such date. The options expire on June 19, 2027. The Company had estimated the fair value of the options granted to
be $369,419 as of the grant date. Accordingly, the Company recorded a charge against earnings in the amount of $30,785 for the fiscal year ended November 30, 2017.
On October 2, 2017, the Company granted non-qualifed stock options for 75,000 shares to Justin W. Mills, III, a director of the Company, at $3.30 per share, which was the closing price of the Company's stock on that day. The options vest twelve months after the date of grant. The options expire on October 1, 2022. The Company had estimated the fair value of the options granted to be $83,813 as of the grant date. Accordingly, the Company recorded a charge against earnings in the amount of $13,969 for the fiscal year ended November 30, 2017.
Awards may be granted under the 2015 Plan to employees (including officers and directors who are also employees) and non-employee directors of the Company provided, however, that Incentive Stock Options may not be granted to any non-employee director or consultant.
The 2015 Plan is administered and interpreted by the Board of Directors. (Where issuance to a Board member is under consideration, that member must abstain.) The Board has the power, subject to plan provisions, to determine the persons to whom and the dates on which awards will be granted, the amount and vesting or exercise provisions of awards, and other terms. The Board has the power to delegate administration to a committee of not less than two (2) Board members, each of whom must be a “non-employee director” within the meaning of Rule 16b-3 under the Securities Exchange Act. Members of the Board receive no compensation for their services in connection with the administration of option plans.
The 2015 Plan permits the exercise of options for cash, or such other method as the Board may permit from time to time.
The maximum term of each option is ten (10) years. No option granted is transferable by the optionee other than upon death.
The exercise price of all options must be at least equal to one hundred percent (100%) of the fair market value of the underlying stock on the date of grant. The aggregate fair market value of stock of the Company (determined at the date of the option grant) for which any employee may be granted Incentive Stock Options in any calendar year may not exceed $100,000, plus certain carryover allowances. The exercise price of an Incentive Stock Option granted to any participant who owns stock possessing more than ten percent (10%) of the voting rights of the Company’s outstanding capital stock must be at least one hundred-ten percent (110%) of the fair market value on the date of grant. As of November 30, 2017, there were 871,500 outstanding stock options under the Plans.
viii. Performance Graph
Set forth below is a line graph comparing cumulative total shareholder return on the Company’s Common Stock, with the cumulative total return of companies in the Dow Jones US Index and the cumulative total return of Dow Jones’s Personal Products Index.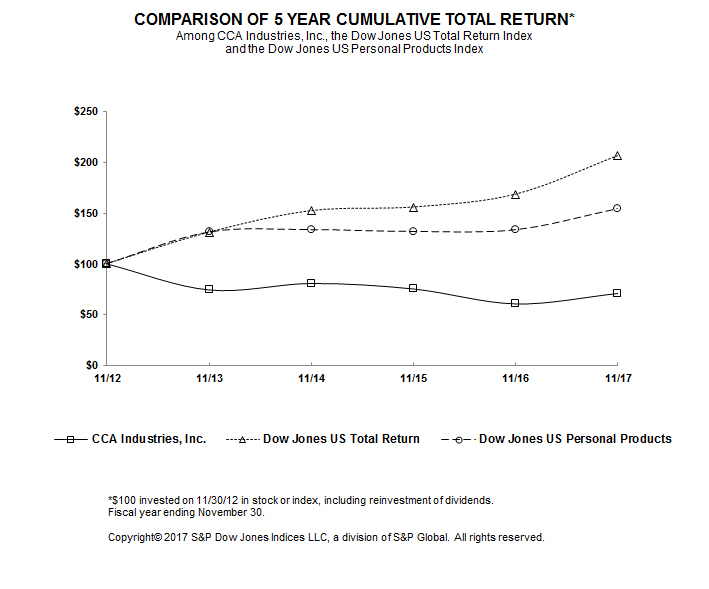
Copyright© 2017 Dow Jones & Company. All rights reserved.
|
| | | | | | | | | | | | | | | | | | |
| | 11/12 | | 11/13 | | 11/14 | | 11/15 | | 11/16 | | 11/17 |
CCA Industries, Inc. | | 100.00 |
| | 74.45 |
| | 80.83 |
| | 75.40 |
| | 60.74 |
| | 70.90 |
|
Dow Jones US Total Return | | 100.00 |
| | 130.99 |
| | 152.13 |
| | 155.76 |
| | 168.35 |
| | 206.21 |
|
Dow Jones US Personal Products | | 100.00 |
| | 131.47 |
| | 133.78 |
| | 132.03 |
| | 133.73 |
| | 154.64 |
|
The Performance Graph in this Item 11 is not deemed to be “soliciting material” or to be “filed” with the SEC or subject to Regulation 14A or 14C under the Securities Exchange Act of 1934 or to the liabilities of Section 18 of the Securities Exchange Act of 1934 and will not be deemed to be incorporated by reference into any filing under the Securities Act of 1933 or the Securities Exchange Act of 1934, except to the extent we specifically incorporate it by reference into such a filing.
Item 12. SECURITY OWNERSHIP OF CERTAIN BENEFICIAL OWNERS AND MANAGEMENT AND RELATED SHAREHOLDER MATTERS
The following table sets forth information as of November 30, 2017 with respect to compensation plans under which shares of the Company’s Common Stock may be issued:
EQUITY COMPENSATION PLAN INFORMATION
|
| | | | | | | | | | |
Plan Category | | Number of shares to be issued upon exercise of out- standing options | | Weighted- average exercise price of outstanding options | | Number of shares remaining and available for future issuance under equity compensation plans (excluding shares in the first column) |
Equity compensation plans approved by security holders on June 15, 2005 | | 45,000 |
| | $ | 3.41 |
| | — |
|
Equity compensation plans approved by security holders on August 13, 2015 | | 826,500 |
| | $ | 3.26 |
| | 573,500 |
|
Equity compensation plans not approved by security holders | | — |
| | — |
| | — |
|
Total | | 871,500 |
| | $ | 3.27 |
| | 573,500 |
|
The following table sets forth certain information regarding the ownership of the Company’s Common Stock, Class A Common Stock and ownership of all shares outstanding as of February 12, 2018 by (i) each of the directors (ii) each of the named executive officers listed in the summary compensation table and (iii) each person that the Company is aware to be the beneficial owner of more than five percent of the outstanding shares of Common Stock and/or Class A Common Stock and (iv) all current officers and directors as a group. Unless otherwise indicated, each of the shareholders has sole voting and investment power with respect to the shares owned (subject to community property laws, where applicable), and is the beneficial owner of them.
Beneficial Ownership of Equity Securities
|
| | | | | | | | | | | | |
| | | | | | Ownership | | Ownership | | Ownership | | Ownership |
| | Number of Shares Owned | | Percentage of | | Percentage of | | Percentage of | | Percent |
Name | | Common Stock | | Class A Common Stock | | Common Stock Outstanding | | Class A Stock Outstanding | | All Shares Outstanding | Option/Warrant Shares | Assuming Option/Warrant Exercise (5) |
Sardar Biglari (2) (6) | | 776,259 | | — | | 12.9% | | —% | | 11.1% | 75,000 | 12.0% |
Philip Cooley | | — | | — | | —% | | —% | | —% | 75,000 | 1.1% |
S. David Fineman | | — | | — | | —% | | —% | | —% | 75,000 | 1.1% |
Lance Funston (1) (6) | | 19,958 | | 967,702 | | 0.3% | | 100.0% | | 14.1% | 75,000 | 15.0% |
Douglas Haas | | — | | — | | —% | | —% | | —% | 110,000 | 1.5% |
Stephen A. Heit | | 31,805 | | — | | 0.5% | | —% | | 0.5% | 105,000 | 1.9% |
Christopher Hogg | | — | | — | | —% | | —% | | —% | 75,000 | 1.1% |
Justin W. Mills, III | | — | | — | | —% | | —% | | —% | 75,000 | 1.1% |
Renaissance Technologies LLC (3) | | 349,100 | | — | | 5.8% | | —% | | 5.0% | — | 5.0% |
Capital Preservation Solutions, LLC (4,5) | | 450,000 | | — | | 7.5% | | —% | | 6.4% | 1,442,744 | 22.4% |
Officers & Directors
As a Group (8 persons) | | 1,278,022 | | 967,702 | | 21.2% | | 100.0% | | 32.1% | 2,107,744 | 47.8% |
| |
(1) | Includes shares owned by Capital Preservation Solutions, LLC which is controlled by Lance Funston. The principal business address of Capital Preservation Solutions, LLC is 193 Conshohocken State Road, Penn Valley, PA 19072. |
| |
(2) | Based on information contained in Schedule 13D/A filed on June 16, 2016 with the SEC by Biglari Holdings Inc. Sardar Biglari is the Chairman and Chief Executive Officer of Biglari Holdings Inc. and has investment discretion over the securities owned. By virtue of these relationships, Sardar Biglari may be deemed to beneficially own the 776,259 shares owned directly by Biglari Holdings Inc. Biglari Holdings Inc. and Sardar Biglari each expressly and respectively disclaims beneficial ownership of such shares except to the extent of their respective pecuniary interest therein. The principal business address of each of Biglari Holdings, Inc. and Sardar Biglari is 17802 IH 10 West, Suite 400, San Antonio, Texas 78257. |
| |
(3) | Based on information contained in Form 13G/A, filed on February 14, 2018 with the SEC by Renaissance Technologies LLC ("RTC") . Their principal address is 800 Third Avenue, New York, New York 10022. |
| |
(4) | Capital Preservation Solutions, LLC is owned by Lance Funston. On September 5, 2014, the Company entered into a Loan and Security Agreement (the “Agreement”) with Capital Preservation Solutions, LLC (“Capital”) for a $5,000,000 working capital line of credit and a term loan for working capital purposes not to exceed $1,000,000. Contemporaneously with the signing of the Agreement, the Company issued a Warrant to Purchase Common Stock (the “Warrant”) to Capital whereby Capital may acquire upon exercise of the Warrant 1,892,744 shares of the Company’s Common Stock. The Warrant may be exercised in whole or in part at any time during the exercise period which is five years from the date of the Warrant. The Warrant bears a purchase price of $3.17 per share, subject to adjustments. The loan under the Agreement was paid in full on December 4, 2015, but the Warrants remained outstanding. On February 5, 2018, Capital exercised the Warrant in part and purchased 450,000 shares at the purchase price of $3.17 per share. The principal business address of Capital Solutions, LLC is 193 Conshohocken State Road, Penn Valley, PA 19072. |
| |
(5) | The number of “Option /Warrant Shares” represents the number of shares that could be purchased by, and upon exercise of unexercised options/warrants; and the percentage ownership figure denominated “Assuming Option/Warrant Exercise” assumes, per person, that unexercised options/warrants have been exercised and, thus, that subject shares have been purchased and are actually owned. In turn, the “assumed” percentage ownership figure is measured, for each owner, as if each had exercised such options, and purchased subject ‘option shares,’ and thus increased total shares actually outstanding, but that no other option owner had ‘exercised and purchased.’ |
| |
(6) | On November 14, 2014, Lance T. Funston entered into an agreement with The Lion Fund, L.P. (the “Lion Fund”) and, for certain limited purposes, Sardar Biglari and Philip L. Cooley (the “Agreement”). The Lion Fund held 776,259 shares of the Company’s Common Stock (the “TLF Shares”), and Mr. Biglari is the sole owner, Chairman and Chief Executive Officer of Biglari Capital Corp., the Lion Fund’s general partner. The TLF Shares are held subject to the Agreement, the terms of which grant the Lion Fund the right to sell all or a portion of the TLF Shares to Mr. Funston or his affiliate at a purchase price of $6.00 per share for a period of 30 days after the Restricted Period End Date (as defined below). Pursuant to the Agreement, the Lion Fund has agreed to certain transfer restrictions on the TLF Shares until the earlier of (a) January 1, 2018 and (b) the occurrence of specified extraordinary transactions, including (i) the execution of a definitive agreement for, or the public announcement of, a sale of the Company in which stockholders will receive less than $6.00 per share (subject to adjustment for stock splits and combinations, stock dividends and similar transactions), or (ii) the bankruptcy of the Company (such earlier date, the “Restricted Period End Date”). The Lion Fund further agreed that, until the Restricted Period End Date, it would vote the TLF Shares in accordance with the Board’s recommendation on any proposal presented to stockholders. For additional information, see the Schedules 13D/A filed by Mr. Funston and the Lion Fund on November 14, 2014. The Agreement was amended on June 14, 2016. The amendment extends the expiration of the restricted period from January 1, 2018 to January 1, 2019. The amendment also allowed the transfer of the shares owned by the Lion Fund to Biglari Holdings Inc. For further information regarding the amendment, see Schedules 13D/A filed by Mr. Funston, the Lion Fund and Biglari Holdings Inc. on June 16, 2016. |
Item 13. CERTAIN RELATIONSHIPS AND RELATED TRANSACTIONS, AND DIRECTOR INDEPENDENCE
On September 5, 2014, the Company entered into a Loan and Security Agreement (the “Agreement”) with Capital Preservation Solutions, LLC (“Capital”) for a $5,000,000 working capital line of credit and a term loan for working capital purposes not to exceed $1,000,000. Capital Preservation Solutions, LLC is owned by Lance Funston, who also is the managing partner of Capital Preservations Holdings, LLC which owns common stock and all of the Company's Class A common stock. Contemporaneously with the signing of the Agreement, the Company issued a Warrant to Purchase Common Stock (the “Warrant”) to Capital whereby Capital may acquire upon exercise of the Warrant 1,892,744 shares of the Company’s Common Stock. The Warrant may be exercised in whole or in part at any time during the exercise period which is five years from the date of the Warrant. The Warrant bears a purchase price of $3.17 per share, subject to adjustments. The working capital line of credit and term loan have been recorded on the consolidated balance sheet as of November 30, 2014 as from a related party. Interest and amortized financing costs in the amount of $3,085 was incurred to Capital and is recorded on the consolidated statement of operations for the year ended November 30, 2016 as interest expense from a related party. The working capital and term loan under the Agreement was paid in full on December 4, 2015, and the Agreement expired on December 5, 2015, but the Warrant remained outstanding. On February 5, 2018, Capital exercised the Warrant in part and purchased 450,000 shares at the purchase price of $3.17 per share.
The Company signed an agreement in December 2014 with Funston Media Management Services, Inc., which is owned by Lance Funston, who is the Company's Chairman of the Board and Chief Executive Officer. The agreement provided for Funston Media Management Services, Inc. to provide consumer advertising purchasing services and brand management for a fee equal to 7.5% of the advertising costs with a minimum fee of $256,200 for the contract period. The agreement also provided for a monthly management fee of $15,000, which was amended to $5,000 per month for the contract period. The agreement ended on November 19, 2015. The Company incurred costs in the amount of $316,200 for the 2015 fiscal year. The Company signed a new agreement in December 2015 with Funston Media Management Services, Inc. The agreement provided for Funston Media Management Services, Inc. to provide consumer advertising purchasing services and brand management for a fee equal to 10.0% of the advertising costs with no minimum fee or monthly management fee. The agreement automatically renews unless canceled by the Company or Funston Media Management Services, Inc. Under the new agreement, the Company incurred costs of $80,938 for the year ended November 30, 2017 and $54,509 for the year ended November 30, 2016. As of November 30, 2017, there were unpaid management fees of $199,578 due to FMM.
In June 2017, the Company rented office space at 193 Conshohocken State Road, Penn Valley, Pennsylvania. The Company paid a monthly rental of $1,000 per month during fiscal 2017 commencing June 2017. The rent is increased to $2,500 per month for fiscal 2018. The building is owned by Lance Funston, the Company's Chief Executive Officer and Chairman of the Board. The Company's Pennsylvania offices house its marketing and sales staff, as well as the office of the Chief Executive Officer. There is no written lease for the facility.
On November 14, 2014, Lance T. Funston entered into an agreement with The Lion Fund, L.P. (the “Lion Fund”) and, for certain limited purposes, Sardar Biglari and Philip L. Cooley (the “Agreement”). The Lion Fund held 776,259 shares of the Company’s Common Stock (the “TLF Shares”), and Mr. Biglari is the sole owner, Chairman and Chief Executive Officer of Biglari Capital Corp., the Lion Fund’s general partner. The TLF Shares are held subject to the Agreement, the terms of which grant the Lion Fund the right to sell all or a portion of the TLF Shares to Mr. Funston or his affiliate at a purchase price of $6.00 per share for a period of 30 days after the Restricted Period End Date (as defined below). Pursuant to the Agreement, the Lion Fund has agreed to certain transfer restrictions on the TLF Shares until the earlier of (a) January 1, 2018 and (b) the occurrence of specified extraordinary transactions, including (i) the execution of a definitive agreement for, or the public announcement of, a sale of the Company in which stockholders will receive less than $6.00 per share (subject to adjustment for stock splits and combinations, stock dividends and similar transactions), or (ii) the bankruptcy of the Company (such earlier date, the “Restricted Period End Date”). The Lion Fund further agreed that, until the Restricted Period End Date, it would vote the TLF Shares in accordance with the Board’s recommendation on any proposal presented to stockholders. For additional information, see the Schedules 13D/A filed by Mr. Funston and the Lion Fund on November 14, 2014. The Agreement was amended on June 14, 2016. The amendment extends the expiration of the restricted period from January 1, 2018 to January 1, 2019. The amendment also allowed the transfer of the shares owned by the Lion Fund to Biglari Holdings Inc. For further information regarding the amendment, see Schedules 13D/A filed by Mr. Funston, the Lion Fund and Biglari Holdings Inc. on June 16, 2016.
The independent directors of the Company are: Sardar Biglari, Philip Cooley, S. David Fineman, Christopher Hogg and Justin W. Mills, III. There were no transactions, relationships or arrangements not disclosed in this item that were considered by the Company’s board of directors in determining the director’s independence.
Item 14. PRINCIPAL ACCOUNTANT FEES AND SERVICES
BDO USA, LLP (“BDO”) served as the Company’s independent registered public accounting firm for 2017, 2016 and 2015. The services performed by BDO in this capacity included conducting an audit in accordance with generally accepted audit standards of, and expressing an opinion on, the Company’s consolidated financial statements.
Audit Fees
BDO’s fees for professional services rendered in connection with the audit and review of Forms 10-K and all other SEC regulatory filings were $171,000 and $191,750 per annum, respectively, for each of the 2017 and 2016 fiscal years. The Company has paid and is current on all billed fees.
Audit Related Fees
There were no audit related fees in fiscal 2017 or fiscal 2016.
Tax Fees
BDO’s fees for professional services rendered in connection with Federal and State tax return preparation and other tax matters for the 2017 and 2016 fiscal years was $31,500 and $35,000, respectively, per annum.
All Other Fees
There were no other fees in fiscal 2017 or fiscal 2016.
Engagements Subject to Approval
Under its charter, the Audit Committee must pre-approve all subsequent engagements of our independent registered public accounting firm unless an exception to such pre-approval exists under the Securities Exchange Act of 1934 or the rules of the Securities and Exchange Commission. Each year, before an independent registered public accounting firm is retained to audit our financial statements, such service and the associated fee, is approved by the committee. At the beginning of the fiscal year, the Audit Committee will evaluate other known potential engagements of the independent registered public accounting firm, including the scope of the work proposed to be performed and
the proposed fees, and approve or reject each service, taking into account whether the services are permissible under applicable law and the possible impact of each non-audit service on the independent registered public accounting firm’s independence from management. At each subsequent committee meeting, the committee will receive updates on the services actually provided by the independent registered public accounting firm, and management may present additional services for approval. The committee has delegated to the Chairman of the committee the authority to evaluate and approve engagements on behalf of the committee in the event that a need arises for pre-approval between committee meetings. If the Chairman so approves any such engagements, he will report that approval to the full committee at the next committee meeting.
PART IV
Item 15. EXHIBITS, FINANCIAL STATEMENTS, SCHEDULES
|
| | |
| (a) (1) | Financial Statements: |
Table of Contents, Report of Independent Registered Public Accounting Firm, Consolidated Balance Sheets as of November 30, 2017 and 2016, Consolidated Statements of Operations for the years ended November 30, 2017, 2016 and 2015, Consolidated Statements of Shareholders’ Equity for the years ended November 30, 2017, 2016 and 2015, Consolidated Statements of Cash Flows for the years ended November 30, 2017, 2016 and 2015, Notes to Consolidated Financial Statements.
Financial Statement Supplementary Information:
|
| | |
| (a) (3) | Exhibits: The following exhibits are filed herewith or incorporated by reference |
(3.1) The Company’s Articles of Incorporation and Amendments thereof, are incorporated by reference to its filing on Form 10-K/A filed April 5, 1995. (SEC file number reference 000-12723) (Exhibit pages 000001-23).
|
| |
(10.1) | License Agreement made February 12, 1986 with Alleghany Pharmacal Corporation is incorporated by reference to the Company’s Form 10-K/A filed April 5, 1995 (SEC file number reference 001-12723). |
|
| |
(11.00) | Statement re Per Share Earnings (included in Item 15, Financial Statements). |
|
| |
(101.Def) | Definition Linkbase Document |
|
| |
(101.Pre) | Presentation Linkbase Document |
|
| |
(101.Lab) | Labels Linkbase Document |
(101.Cal) Calculation Linkbase Document
(101.Sch) Schema Document
(101.Ins) Instance Document
|
| |
* | Management contract and compensatory plan or arrangement. |
** | Filed herewith. |
Shareholders may obtain (without charge) a copy of this Annual Report on Form 10-K (including the financial statements and financial statement schedules) and a copy of any exhibit not filed herewith (upon payment of a fee limited to our reasonable expenses in furnishing such exhibit) by writing to CCA Industries, Inc., 1099 Wall Street West, Suite 275, Lyndhurst, NJ 07071. The Company also makes the reports it files to be available in the Investor Relations section of its website (http://www.ccainvestor.com). Moreover, the public may read and copy any materials we file with the SEC (including the exhibits thereto) at the SEC’s Public Reference Room at 100 F Street, NE, Washington, DC 20549. You may obtain information on the operation of the Public Reference Room by calling the SEC at 1-800-SEC-0330. In addition, the SEC maintains an Internet site that contains reports, proxy and information statements, and other information regarding issuers that file electronically with the SEC (http://www.sec.gov).
SIGNATURES
Pursuant to the requirements of Section 13 or 15(d) of the Securities Exchange Act of 1934, the Registrant has duly caused this Annual Report to be signed on its behalf by the undersigned thereunto duly authorized.
|
| | |
| | |
CCA INDUSTRIES, INC. |
| |
By: | | /s/ LANCE FUNSTON |
| | LANCE FUNSTON, Chief Executive Officer |
| |
Date: | | February 28, 2018 |
Pursuant to the requirements of the Securities Exchange Act of 1934, this Annual Report has been signed below by the following persons on behalf of the Registrant and in the capacities and on the dates indicated.
|
| | | | |
| | | | |
Signature | | Title | | Date |
/s/ LANCE FUNSTON | | Chairman of the Board, Chief Executive Officer | | February 28, 2018 |
LANCE FUNSTON | | and President | | |
| | | | |
/s/ STEPHEN A. HEIT | | Director, Chief Financial Officer and Chief Accounting Officer | | February 28, 2018 |
STEPHEN A. HEIT | | | | |
| | | |
/s/ SARDAR BIGLARI | | Director | | February 28, 2018 |
SARDAR BIGLARI | | | | |
| | | |
/s/ PHILIP COOLEY | | Director | | February 28, 2018 |
PHILIP COOLEY | | | | |
| | | |
/s/ S. DAVID FINEMAN | | Director | | February 28, 2018 |
S. DAVID FINEMAN | | | | |
| | | |
/s/ CHRISTOPHER HOGG | | Director | | February 28, 2018 |
CHRISTOPHER HOGG | | | | |
| | | | |
/s/ JUSTIN W. MILLS, III | | Director | | February 28, 2018 |
JUSTIN W. MILLS, III | | | | |
| | | | |
| | | |
| | | | |
| | | | |
CCA INDUSTRIES, INC. AND SUBSIDIARIES
CONSOLIDATED FINANCIAL STATEMENTS
NOVEMBER 30, 2017 AND 2016
C O N T E N T S
|
| |
| |
| |
| |
FINANCIAL STATEMENTS: | |
| |
| |
| |
| |
| |
| |
| |
| |
| |
| |
| |
SUPPLEMENTARY INFORMATION | |
| |
| |
| |
EXHIBITS | |
Report of Independent Registered Public Accounting Firm
Board of Directors and Shareholders
CCA Industries, Inc.
Lyndhurst, New Jersey
We have audited the accompanying consolidated balance sheets of CCA Industries, Inc. and Subsidiaries as of November 30, 2017 and 2016 and the related consolidated statements of operations, shareholders’ equity, and cash flows for each of the three years in the period ended November 30, 2017. In connection with our audits of the financial statements, we have also audited the financial statement schedule listed in the accompanying index. These financial statements and schedule are the responsibility of the Company’s management. Our responsibility is to express an opinion on these financial statements and schedule based on our audits.
We conducted our audits in accordance with the standards of the Public Company Accounting Oversight Board (United States). Those standards require that we plan and perform the audit to obtain reasonable assurance about whether the financial statements are free of material misstatement. The Company is not required to have, nor were we engaged to perform, an audit of its internal control over financial reporting. Our audits included consideration of internal control over financial reporting as a basis for designing audit procedures that are appropriate in the circumstances, but not for the purpose of expressing an opinion on the effectiveness of the Company’s internal control over financial reporting. Accordingly, we express no such opinion. An audit also includes examining, on a test basis, evidence supporting the amounts and disclosures in the financial statements, assessing the accounting principles used and significant estimates made by management, as well as evaluating the overall financial statement presentation of the financial statements and schedule. We believe that our audits provide a reasonable basis for our opinion.
In our opinion, the consolidated financial statements referred to above present fairly, in all material respects, the financial position of CCA Industries, Inc. and Subsidiaries at November 30, 2017 and 2016, and the results of its operations and its cash flows for each of the three years in the period ended November 30, 2017, in conformity with accounting principles generally accepted in the United States of America.
Also, in our opinion, the financial statement schedule, when considered in relation to the basic consolidated financial statements taken as a whole, presents fairly, in all material respects, the information set forth therein.
/s/ BDO USA, LLP
Woodbridge, New Jersey
February 28, 2018
` Part I - FINANCIAL INFORMATION
ITEM 1. - FINANCIAL STATEMENTS
CCA INDUSTRIES, INC. AND SUBSIDIARIES
CONSOLIDATED BALANCE SHEETS
|
| | | | | | | | |
| | November 30,
2017 | | November 30,
2016 |
ASSETS | | | | |
Current assets: | | | | |
Cash & cash equivalents | | $ | 140,243 |
| | $ | 309,280 |
|
Accounts receivable, net of allowances of $540,361 and $1,392,380, respectively | | 2,585,517 |
| | 2,147,680 |
|
Inventories, net of reserve for inventory obsolescence of $158,269 and $500,156, respectively | | 1,878,831 |
| | 2,347,483 |
|
Prepaid expenses and sundry receivables | | 642,000 |
| | 466,060 |
|
Prepaid and refundable income taxes | | 38,153 |
| | 44,154 |
|
Deferred income taxes | | 2,079,988 |
| | 2,148,764 |
|
Total Current Assets | | 7,364,732 |
| | 7,463,421 |
|
| | | | |
Property and equipment, net of accumulated depreciation | | 140,929 |
| | 235,203 |
|
Intangible assets, net of accumulated amortization | | 432,320 |
| | 433,778 |
|
Deferred financing fees, net of accumulated amortization | | 133,322 |
| | 259,587 |
|
Deferred income taxes | | 7,422,331 |
| | 8,415,699 |
|
Other | | 436,825 |
| | 430,544 |
|
Total Assets | | $ | 15,930,459 |
| | $ | 17,238,232 |
|
| | | | |
LIABILITIES AND SHAREHOLDERS' EQUITY | | | | |
Current liabilities: | | | | |
Accounts payable & accrued liabilities | | $ | 3,617,543 |
| | $ | 5,615,756 |
|
Capitalized lease obligations - current portion | | — |
| | 3,721 |
|
Income tax payable | | — |
| | 20,000 |
|
Line of credit | | 2,016,355 |
| | 3,277,885 |
|
Total Current Liabilities | | 5,633,898 |
| | 8,917,362 |
|
| | | | |
Long-term accrued liabilities | | 220,509 |
| | 264,126 |
|
Long term- other | | 168,859 |
| | 147,853 |
|
Total Liabilities | | 6,023,266 |
| | 9,329,341 |
|
| | | | |
Shareholders' Equity: | |
|
| |
|
|
Preferred stock, $1.00 par, authorized 20,000,000 none issued | | — |
| | — |
|
Common stock, $.01 par, authorized 15,000,000 shares, issued and outstanding 6,038,982 and 6,038,982 shares, respectively | | 60,390 |
| | 60,390 |
|
Class A common stock, $.01 par, authorized 5,000,000 shares, issued and outstanding 967,702 and 967,702 shares, respectively | | 9,677 |
| | 9,677 |
|
Additional paid-in capital | | 4,387,543 |
| | 4,220,422 |
|
Retained earnings | | 5,449,583 |
| | 3,618,402 |
|
Total Shareholders' Equity | | 9,907,193 |
| | 7,908,891 |
|
Total Liabilities and Shareholders' Equity | | $ | 15,930,459 |
| | $ | 17,238,232 |
|
See Notes to Consolidated Financial Statements.
CCA INDUSTRIES, INC. AND SUBSIDIARIES
CONSOLIDATED STATEMENTS OF OPERATIONS
|
| | | | | | | | | | | | | |
| | | Years Ended November 30, |
| | | 2017 | | 2016 | | 2015 |
Revenues: | | | | | | | |
Sales of health and beauty aid products - net | | | $ | 19,813,262 |
| | $ | 19,610,234 |
| | $ | 24,753,950 |
|
Other income | | | 16,836 |
| | 18,510 |
| | 35,605 |
|
Total Revenues | | | 19,830,098 |
| | 19,628,744 |
| | 24,789,555 |
|
Costs and Expenses: | | | | | | | |
Cost of sales | | | 7,447,776 |
| | 8,158,099 |
| | 10,445,369 |
|
Selling, general and administrative expenses | | | 7,052,219 |
| | 7,434,389 |
| | 11,574,045 |
|
Advertising, cooperative and promotional expenses | | | 1,769,748 |
| | 1,219,413 |
| | 3,524,074 |
|
Research and development | | | 58,920 |
| | 46,382 |
| | 75,208 |
|
Bad debt (recovery) expense | | | (9,172 | ) | | 37,503 |
| | (20,730 | ) |
Interest expense - related party | | | — |
| | 3,085 |
| | 1,735,967 |
|
Interest expense | | | 505,872 |
| | 588,656 |
| | 15,157 |
|
Total Costs and Expenses before Restructuring | | | 16,825,363 |
| | 17,487,527 |
| | 27,349,090 |
|
Restructuring Cost | | | — |
| | — |
| | 2,289,406 |
|
Total Costs and Expenses | | | 16,825,363 |
| | 17,487,527 |
| | 29,638,496 |
|
Income (loss) before provision for (benefit from) Income Taxes | | | 3,004,735 |
| | 2,141,217 |
| | (4,848,941 | ) |
Provision for (benefit from) Income Taxes | | | 1,173,554 |
| | 948,533 |
| | (1,592,309 | ) |
Income (loss) from Continuing Operations | | | 1,831,181 |
| | 1,192,684 |
| | (3,256,632 | ) |
Discontinued Operations | | | | | | | |
(Loss) Income from discontinued operations | | | — |
| | (20,600 | ) | | 18,494 |
|
(Benefit from) provision for Income Taxes | | | — |
| | (9,126 | ) | | 6,073 |
|
(Loss) Income from Discontinued Operations | | | — |
| | (11,474 | ) | | 12,421 |
|
Net Income (Loss) | | | $ | 1,831,181 |
| | $ | 1,181,210 |
| | $ | (3,244,211 | ) |
| | | | | | | |
Net Income (Loss) per Share: | | | | | | | |
Basic | | | | | | | |
Continuing Operations | | | $ | 0.26 |
| | $ | 0.17 |
| | $ | (0.46 | ) |
Discontinued Operations | | | $ | — |
| | $ | — |
| | $ | — |
|
Net income (loss) per share | | | $ | 0.26 |
| | $ | 0.17 |
| | $ | (0.46 | ) |
| | | | | | | |
Net Income (Loss) per Share: | | | | | | | |
Diluted | | | | | | | |
Continuing Operations | | | $ | 0.26 |
| | $ | 0.17 |
| | $ | (0.46 | ) |
Discontinued Operations | | | $ | — |
| | $ | — |
| | $ | — |
|
Net income (loss) per share | | | $ | 0.26 |
| | $ | 0.17 |
| | $ | (0.46 | ) |
| |
|
|
| |
|
| |
|
|
Weighted Average Shares Outstanding: | | | | | | | |
Basic | | | 7,006,684 |
| | 7,006,684 |
| | 7,006,684 |
|
Diluted | | | 7,006,684 |
| | 7,021,764 |
| | 7,006,684 |
|
Supplemental Information: In addition to interest expense - related party in the Consolidated Statement of Operations, the Company has expenses of $223,649, $54,509 and $316,200, respectively, incurred to a related party.
See Notes to Consolidated Financial Statements.
CCA INDUSTRIES, INC. AND SUBSIDIARIES
CONSOLIDATED STATEMENTS OF SHAREHOLDERS' EQUITY
FOR THE YEARS ENDED NOVEMBER 2017, 2016 AND 2015
|
| | | | | | | | | | | | | | | | | | |
| | | | | | | | | |
| | | | | ADDITIONAL | | | | TOTAL |
| COMMON STOCK | | PAID IN | | RETAINED | | SHAREHOLDERS' |
| SHARES | | AMOUNT | | CAPITAL | | EARNINGS | | EQUITY |
Balance – December 1, 2014 | 7,006,684 |
| | $ | 70,067 |
| | $ | 3,814,484 |
| | $ | 5,681,403 |
| | $ | 9,565,954 |
|
Net loss for the year | — |
| | — |
| | — |
| | (3,244,211 | ) | | (3,244,211 | ) |
Deferred compensation | — |
| | — |
| | 67,398 |
| | — |
| | 67,398 |
|
Balance - November 30, 2015 | 7,006,684 |
| | 70,067 |
| | 3,881,882 |
| | 2,437,192 |
| | 6,389,141 |
|
Net income for the year | — |
| | — |
| | — |
| | 1,181,210 |
| | 1,181,210 |
|
Deferred compensation | — |
| | — |
| | 338,540 |
| | — |
| | 338,540 |
|
Balance - November 30, 2016 | 7,006,684 |
| | 70,067 |
| | 4,220,422 |
| | 3,618,402 |
| | 7,908,891 |
|
Net income for the year | — |
| | — |
| | — |
| | 1,831,181 |
| | 1,831,181 |
|
Deferred compensation | — |
| | — |
| | 167,121 |
| | — |
| | 167,121 |
|
Balance - November 30, 2017 | 7,006,684 |
| | $ | 70,067 |
| | $ | 4,387,543 |
| | $ | 5,449,583 |
| | $ | 9,907,193 |
|
See Notes to Consolidated Financial Statements.
CCA INDUSTRIES, INC. AND SUBSIDIARIES
CONSOLIDATED STATEMENTS OF CASH FLOWS
|
| | | | | | | | | | | |
| Years Ended November 30, |
| 2017 | | 2016 | | 2015 |
Cash Flows from Operating Activities: | | | | | |
Net Income (loss) | $ | 1,831,181 |
| | $ | 1,181,210 |
| | $ | (3,244,211 | ) |
Adjustments to reconcile net income (loss) to cash provided by (used in) operating activities: | | | | | |
Depreciation and amortization | 84,641 |
| | 81,845 |
| | 151,250 |
|
Provision for bad debt | (9,172 | ) | | 37,503 |
| | (20,370 | ) |
Loss on disposal or sale of property, plant and equipment | 64,853 |
| | 1,575 |
| | 852,606 |
|
Loss on write off of intangibles | 1,070 |
| | — |
| | 220,286 |
|
Debt discount amortization - related party | — |
| | — |
| | 194,184 |
|
Deferred financing fees amortization - related party | — |
| | — |
| | 970,931 |
|
Deferred financing fees amortization | 126,266 |
| | 127,972 |
| | 370,527 |
|
Stock-based compensation | 167,121 |
| | 338,540 |
| | 67,398 |
|
Deferred income taxes | 1,062,144 |
| | 890,458 |
| | (1,583,441 | ) |
Change in Operating Assets & Liabilities: | | | | | |
(Increase) decrease in accounts receivable | (428,665 | ) | | (73,128 | ) | | 156,616 |
|
Decrease in inventory | 468,652 |
| | 889,319 |
| | 1,944,688 |
|
(Increase) decrease in prepaid expenses and other receivables | (175,941 | ) | | 231,037 |
| | (65,898 | ) |
Decrease in prepaid income and refundable income tax | 6,002 |
| | 25,902 |
| | 383,542 |
|
(Increase) in other assets | (6,282 | ) | | — |
| | (430,544 | ) |
(Decrease) in accounts payable and accrued liabilities | (2,041,828 | ) | | (2,029,797 | ) | | (3,085,478 | ) |
(Decrease) increase in long-term liabilities | — |
| | (978,156 | ) | | 1,242,282 |
|
Increase in other liabilities | 21,006 |
| | — |
| | 147,853 |
|
(Decrease) Increase in income taxes payable | (20,000 | ) | | 20,000 |
| | — |
|
Net Cash Provided by (Used in) Operating Activities | 1,151,048 |
| | 744,280 |
| | (1,727,779 | ) |
Cash Flows from Investing Activities: | | | | | |
Acquisition of property, plant and equipment | (54,833 | ) | | (113,701 | ) | | (113,495 | ) |
Proceeds from sale of property, plant and equipment | — |
| | 500 |
| | 13,600 |
|
Net Cash (Used in) Provided by Investing Activities | (54,833 | ) | | (113,201 | ) | | (99,895 | ) |
Cash Flows from Financing Activities: | | | | | |
(Payments to) Proceeds from line of credit | (1,261,530 | ) | | 3,277,885 |
| | — |
|
(Payments to) Proceeds from line of credit - related party | — |
| | (2,700,000 | ) | | 2,100,000 |
|
Payments of deferred finance charges | — |
| | (387,559 | ) | | — |
|
Repayments of term loan - related party | — |
| | (1,000,000 | ) | | — |
|
Payments for capital lease obligations | (3,722 | ) | | (22,009 | ) | | (4,063 | ) |
Net Cash (Used in) Provided by Financing Activities | (1,265,252 | ) | | (831,683 | ) | | 2,095,937 |
|
Net (Decrease) Increase in Cash | (169,037 | ) | | (200,604 | ) | | 268,263 |
|
Cash and Cash Equivalents at Beginning of Period | 309,280 |
| | 509,884 |
| | 241,621 |
|
Cash and Cash Equivalents at End of Period | $ | 140,243 |
| | $ | 309,280 |
| | $ | 509,884 |
|
| | | | | |
| | | | | |
| | | | | |
| | | | | |
| | | | | |
| | | | | |
|
| | | | | | | | | | | |
| Years Ended November 30, |
| 2017 | | 2016 | | 2015 |
Supplemental Disclosures of Cash Flow Information: | | | | | |
Cash paid during the period for: | | | | | |
Interest | $ | 505,872 |
| | $ | 588,205 |
| | $ | 1,380,598 |
|
Income taxes | $ | 120,393 |
| | $ | 8,460 |
| | $ | 59,107 |
|
Schedule of Non Cash Financing Activities: | | | | | |
Warrants issued in connection with related party financing | $ | — |
| | $ | — |
| | $ | 1,456,400 |
|
See Notes to Consolidated Financial Statements
NOTE 1 - ORGANIZATION AND DESCRIPTION OF BUSINESS
CCA Industries, Inc. (“CCA”) was incorporated in the State of Delaware on March 25, 1983. CCA is doing business as Core Care America.
CCA manufactures and distributes health and beauty aid products.
CCA has a wholly-owned subsidiary. CCA Online Industries, Inc. which is currently inactive and will be dissolved.
NOTE 2 - SUMMARY OF SIGNIFICANT ACCOUNTING POLICIES
Principles of Consolidation:
The consolidated financial statements include the accounts of CCA and its wholly-owned subsidiaries (collectively the “Company”). All significant inter-company accounts and transactions have been eliminated.
Estimates and Assumptions:
The consolidated financial statements include the use of estimates, which management believes are reasonable. The process of preparing financial statements in conformity with accounting principles generally accepted in the United States (“GAAP”), requires management to make estimates and assumptions regarding certain types of assets, liabilities, revenues, and expenses. Such estimates primarily relate to unsettled transactions and events as of the date of the financial statements. Accounting estimates and assumptions are those that management considers to be most critical to the financial statements because they inherently involve significant judgment and uncertainties. All of these estimates and assumptions reflect management’s best judgment about current economic and market conditions and their effects on the information available as of the date of the consolidated financial statements. Accordingly, upon settlement, actual results may differ from estimated amounts.
Cash and Cash Equivalents:
The Company considers all highly liquid instruments purchased with an original maturity of three months or less to be cash equivalents.
Accounts Receivable:
Accounts receivable consist of trade receivables recorded at original invoice amount, less an estimated allowance for uncollectible amounts. The accounts receivable balance is further reduced by an allowance for cooperative advertising and reserves for returns which are anticipated to be taken as credits against the balances as of November 30, 2017. The allowances and reserves which are anticipated to be deducted from future invoices are included in accrued liabilities. Trade credit is generally extended on a short term basis; thus trade receivables do not bear interest. Trade receivables are periodically evaluated for collectability based on past credit history with customers and their current financial condition. Changes in the estimated collectability of trade receivables are recorded in the results of operations for the period in which the estimate is revised. Trade receivables that are deemed uncollectible are offset against the allowance for uncollectible accounts. The Company generally does not require collateral for trade receivables.
Inventories:
Inventories are stated at the lower of cost (weighted average) or net realizable value. Product returns deemed saleable are recorded in inventory when they are received at the lower of their original cost or net realizable value, as appropriate. Obsolete inventory is written off and its value is removed from inventory at the time its obsolescence is determined.
Property and Equipment and Depreciation and Amortization:
Property and equipment are stated at cost. The Company charges to expense repairs and maintenance items, while major improvements and betterments are capitalized.
CCA INDUSTRIES, INC. AND SUBSIDIARIES
NOTES TO CONSOLIDATED FINANCIAL STATEMENTS
NOTE 2 - SUMMARY OF SIGNIFICANT ACCOUNTING POLICIES (continued)
When the Company sells or otherwise disposes of property and equipment items, the cost and related accumulated depreciation are removed from the respective accounts and any gain or loss is included in earnings.
Depreciation and amortization are provided utilizing the straight-line method over the following estimated useful lives or lease terms of the assets, whichever is shorter:
|
| |
Machinery and equipment | 5-7 Years |
Furniture and fixtures | 3-10 Years |
Tools, dies and masters | 3 Years |
Intangible Assets:
Intangible assets, which consist of patents and trademarks, are stated at cost. Patents are amortized on the straight-line method over a period of 17 years. Patents are reviewed for impairment when events or changes in business indicate that the carrying amount may not be recoverable. Trademarks are indefinite lived intangible assets and are reviewed for impairment annually or more frequently if impairment conditions occur. In the years ended November 30, 2017, November 30, 2016 and November 30, 2015, the Company determined that it would no longer use certain trademarks and recorded charges of $1,070, $0 and $220,286, respectively, to write off the related carrying amount which is recorded in selling, general and administrative expenses.
Long-Lived Assets:
Long-lived assets are assets in which the Company has an economic benefit for longer than twelve months from the date of the financial statements. Long-lived assets include property and equipment, intangible assets, deferred income taxes and other assets. The Company evaluates impairment losses on long-lived assets used in operations when events and circumstances indicate that the asset might be impaired. If the review indicates that the carrying value of an asset will not be recoverable, based on a comparison of the carrying value of the asset to the undiscounted future cash flows, the impairment will be measured by comparing the carrying value of the asset to its fair value. Fair value will be determined based on quoted market values, discounted cash flows or appraisals. Impairments are recorded in the statement of operations as part of selling, general and administrative expenses.
Revenue Recognition: (See also Cooperative Advertising)
The Company recognizes sales in accordance with ASC Topic 605 “Revenue Recognition”. Revenue is recognized upon shipment of merchandise. Net sales comprise gross revenues less expected returns, trade discounts, customer allowances and various sales incentives. Included in sales incentives are coupons that the Company issues that are redeemed by its customers. Redemptions are handled by a coupon national clearing house. The Company also has estimated that there is an approximate six week lag in coupon redemptions, with the estimated cost recorded as an accrued liability. Although no legal right of return exists between the customer and the Company, returns, including return of unsold products, are accepted if it is in the best interests of the Company's relationship with the customer. The Company, therefore, records a reserve for returns based on the historical returns as a percentage of sales in the three preceding months, adjusting for returns that can be put back into inventory, and a specific reserve based on customer circumstances. The reserves which are anticipated to be deducted from future invoices are included in accrued liabilities. Changes in the estimated coupon reserve and sales return reserve are recorded to Sales of health and beauty aid products - net, in the Consolidated Statement of Operations.
Cooperative Advertising:
Cooperative advertising is accrued based on a combination of new contracts given to the customers in the current fiscal year, along with what is left open from prior years. Specific new contracts in the current fiscal year are identified as sales incentives (see sales incentives) and those contracts reduce revenues for the current period. The open balances for all years open are reduced throughout the year by either the customer advertising and submitting the proof according to the contract or by customer post audit adjustments that finalize any amount due. Any item open more than three years is closed unless management believes that a deduction may still be taken by the customer. The balance of open
CCA INDUSTRIES, INC. AND SUBSIDIARIES
NOTES TO CONSOLIDATED FINANCIAL STATEMENTS
NOTE 2 - SUMMARY OF SIGNIFICANT ACCOUNTING POLICIES (continued)
cooperative advertising is then allocated between accrued liabilities and the allowance for cooperative advertising based the customer's open accounts receivable balance. As a result of completion of customer post audit reviews, open cooperative advertising that was accrued for in previous years was decreased by $817,972 for the fiscal year ended November 30, 2017. For fiscal year ended November 30, 2016 and 2015, the reserve for open cooperative advertising was decreased $589,167 and $670,513, respectively.
Sales Incentives:
The Company has accounted for certain sales incentives offered to customers by charging them directly to sales as opposed to advertising and promotional expense. These accounting adjustments do not affect net loss.
Shipping Costs:
The Company’s policy for financial reporting is to charge shipping costs as part of selling, general and administrative expenses as incurred. For the years ended November 30, 2017, 2016 and 2015 included in selling, general and administrative expenses are shipping costs of $346,408, $447,610 and $616,367, respectively.
Advertising Costs:
The Company’s policy for financial reporting is to charge advertising cost to expense as incurred. Advertising, cooperative and promotional expenses for the years ended November 30, 2017, 2016 and 2015 were $1,769,748, $1,219,413 and $3,524,074, respectively.
Research and Development Costs:
The Company's policy for financial reporting is to charge research and development costs to expense as incurred. Research and development costs for the years ended November 30, 2017, 2016 and 2015 were $58,920, $46,382 and $75,208, respectively.
Income Taxes:
Income taxes are accounted for under ASC Topic 740 “Income Taxes”, which utilizes the asset and liability method. Deferred tax assets and liabilities are recognized for future tax consequences attributable to the temporary differences between the carrying amounts of assets and liabilities as recorded on the Company’s financial statements and the carrying amounts as reflected on the Company’s income tax return. In addition, the portion of charitable contributions that cannot be deducted in the current period and are carried forward to future periods are also reflected in the deferred tax assets. A substantial portion of the deferred tax asset is due to the losses incurred in fiscal 2015 and prior years, the benefit of which will be carried forward into future tax years. Deferred tax assets and liabilities are valued using the tax rates expected to apply in the years in which those temporary differences are expected to be recovered or settled. Deferred tax assets are reduced by a valuation allowance when, in the opinion of management, it is more likely than not that some portion, or all of the deferred tax asset will not be realized. Management has estimated that it will utilize the entire deferred tax asset in future years based on projections of future profits. However profits can be impacted in the future if the Company’s sales decrease. The portion that management expects to utilize in fiscal 2018 is recorded as a short term asset, and the portion that management expects to utilize in fiscal years subsequent to fiscal 2018 are recorded as a long term asset. Beginning in the first quarter of fiscal 2018, in accordance with ASU 2015-17, all deferred tax assets and liabilities will be recorded as a long term asset.
The Company previously adopted the provisions of ASC Subtopic 740-10-25, “Uncertain Tax Positions”. Management believes that there were no unrecognized tax benefits, or tax positions that would result in uncertainty regarding the deductions taken, as of November 30, 2017 and November 30, 2016. ASC Subtopic 740-10-25 prescribes a recognition threshold and a measurement attribute for the financial statement recognition and measurement of tax positions taken or expected to be taken in a tax return. For those benefits to be recognized, a tax position must be more-likely-than-not to be sustained upon examination by taxing authorities.
Tax Credits:
Tax credits, when present, are accounted for using the flow-through method as a reduction of income taxes in the
CCA INDUSTRIES, INC. AND SUBSIDIARIES
NOTES TO CONSOLIDATED FINANCIAL STATEMENTS
NOTE 2 - SUMMARY OF SIGNIFICANT ACCOUNTING POLICIES (continued)
years utilized.
Income (Loss) Per Common Share:
Basic net (loss) income per share is calculated in accordance with ASC Topic 260, “Earnings Per Share”, which requires using the average number of shares of common stock outstanding during the year. Diluted net (loss) income per share is computed on the basis of the average number of common shares outstanding plus the dilutive effect of any common stock equivalents using the “treasury stock method” and warrants. Common stock equivalents consist of stock options.
Stock Options:
ASC Topic 718, “Stock Compensation,” requires stock grants to employees to be recognized in the consolidated statement of operations based on their fair values. The Company issued stock options in fiscal 2017 and 2016, see Note 16 for details.
Reclassifications:
Certain prior years amounts have been reclassified to conform with the current year’s presentation.
Recent Accounting Pronouncements
In February 2016, the Financial Accounting Standards Board ("FASB") issued Accounting Standards Update No. 2016-02, Leases. The new standard establishes a right-of-use (ROU) model that requires a lessee to record a ROU asset and a lease liability on the balance sheet for all leases with terms longer than 12 months. Leases will be classified as either finance or operating, with classification affecting the pattern of expense recognition in the income statement. The new standard is effective for fiscal years beginning after December 15, 2018, including interim periods within those fiscal years. A modified retrospective transition approach is required for lessees for capital and operating leases existing at, or entered into after, the beginning of the earliest comparative period presented in the financial statements, with certain practical expedients available. While we are still evaluating the impact of our pending adoption of the new standard on our consolidated financial statements, we expect that upon adoption we will recognize ROU assets and lease liabilities and that the amounts could be material.
In November 2015, the FASB issued ASU 2015-17, which is an update to Topic 740, "Income Taxes". The update will require that all deferred tax assets and liabilities be classified as non-current. The update is effective for fiscal years, and the interim periods within those years, beginning after December 15, 2016. ASU 2015-17 will have a material impact on the Company's balance sheet, as the deferred tax reported as a current asset will be reported as a non-current asset once the update is effective, resulting in a decrease to the Company's current ratio. As of November 30, 2017, the Company reported $2,079,988 of deferred tax as a current asset. The Company will be reporting all deferred tax assets as a non-current asset beginning with the first quarter of fiscal 2018. It is not expected to have a material impact on the Company's results of operations.
In May 2014, the FASB issued ASU 2014-09, “Revenue from Contracts with Customers”. This new standard will replace most existing revenue recognition guidance in U.S. GAAP when it becomes effective. The underlying principle of this new standard is that an entity should recognize revenue to depict the transfer of promised goods or services to customers in an amount that reflects the consideration for which the entity expects to be entitled in exchange for those goods or services. Entities may adopt this new standard either retrospectively for all periods presented in the financial statements (i.e., the full retrospective method) or as a cumulative-effect adjustment as of the date of adoption (i.e., the modified retrospective method), without applying to comparative years’ financial statements. In August 2015, the FASB issued ASU No. 2015-14, “Revenue from Contracts with Customers: Deferral of the Effective Date,” which changed the effective date for implementation to annual reporting periods, including interim reporting periods within those periods, beginning after December 15, 2017. Early adoption is permitted as of annual reporting periods beginning after December 15, 2016, including interim reporting periods within those annual periods. The Company does not plan to adopt ASU 2014-09 until its 2019 fiscal year which begins on December 1, 2018. The Company is currently in the process of evaluating the impact that ASU No. 2014-09 will have on the Company’s results of operations, financial condition and financial statement disclosures and will provide further updates in future periods.
CCA INDUSTRIES, INC. AND SUBSIDIARIES
NOTES TO CONSOLIDATED FINANCIAL STATEMENTS
NOTE 2 - SUMMARY OF SIGNIFICANT ACCOUNTING POLICIES (continued)
Management does not believe that any recently issued, but not yet effective, accounting standards if currently adopted would have a material effect on the accompanying financial statements.
NOTE 3 - INVENTORIES
The components of inventory consist of the following:
|
| | | | | | | | |
| | November 30,
2017 | | November 30,
2016 |
Raw materials | | $ | 231,558 |
| | $ | 586,372 |
|
Finished goods | | 1,647,273 |
| | 1,761,111 |
|
| | $ | 1,878,831 |
| | $ | 2,347,483 |
|
At November 30, 2017 and November 30, 2016, the Company had a reserve for obsolescence of $158,269 and $500,156, respectively.
NOTE 4 - PROPERTY AND EQUIPMENT
The components of property and equipment consisted of the following:
|
| | | | | | | | |
| | November 30,
2017 | | November 30,
2016 |
Furniture and equipment | | 163,062 |
| | 559,971 |
|
Tools, dies and masters | | 127,361 |
| | 469,652 |
|
Capitalized lease obligations | | 15,286 |
| | 15,286 |
|
Leasehold improvements | | — |
| | 35,017 |
|
| | $ | 305,709 |
| | $ | 1,079,926 |
|
Less: Accumulated depreciation | | 164,780 |
| | 844,723 |
|
Property and Equipment—Net | | $ | 140,929 |
| | $ | 235,203 |
|
Depreciation expense for the years ended November 30, 2017, 2016 and 2015 amounted to $84,253, $81,457 and $150,862, respectively. Due to the Company's move in December 2017 from its offices in Ridgefield Park, New Jersey to new offices in Lyndhurst, New Jersey, the Company wrote off $64,853 of leasehold improvements, furnishings and computer equipment no longer used in fiscal 2017. The Company wrote off $0 and $860,969, respectively, for the year ended November 30, 2017 and 2016.
NOTE 5 - INTANGIBLE ASSETS
Intangible assets consist of owned trademarks and patents for ten product lines.
|
| | | | | | | | |
| | November 30,
2017 | | November 30,
2016 |
Patents and trademarks | | $ | 578,937 |
| | $ | 580,007 |
|
Less: Accumulated amortization | | 146,617 |
| | 146,229 |
|
Intangible Assets - Net | | $ | 432,320 |
| | $ | 433,778 |
|
Patents are amortized on a straight-line basis over their legal life of 17 years. Trademarks have an indefinite life and are reviewed annually for impairment or more frequently if impairment indicators occur. During the fiscal years ended November 30, 2017, 2016 and 2015, the Company wrote off $1,070, $0 and $220,286, respectively, of patents and trademarks, as part of its annual evaluation of patents and trademarks that were no longer in use and did not have any plans for future use. Amortization expense for the fiscal years ended November 30, 2017, 2016 and 2015, was $388, $388 and $388, respectively. Estimated amortization expense for the years ending November 30, 2018, 2019, 2020, 2021 and 2022 are $388, $376, $243, $243 and $243, respectively.
CCA INDUSTRIES, INC. AND SUBSIDIARIES
NOTES TO CONSOLIDATED FINANCIAL STATEMENTS
NOTE 6 - ACCOUNTS PAYABLE and ACCRUED EXPENSES
The following items which exceeded 5% of total current liabilities are included in accrued expenses as of:
|
| | | | | |
| November 30,
2017 | | November 30,
2016 |
Coop advertising | $1,122,904 | | $1,741,402 |
Restructuring Costs | * |
| | 925,000 |
|
Bonus expense | 400,166 |
| | * |
|
* Less than 5% of total current liabilities
The following items which exceeded 5% of total long-term liabilities are included in long-term accrued expenses as of:
|
| | | | | |
| November 30,
2017 | | November 30,
2016 |
Sub-lease rent differential | 220,509 |
| | 264,126 |
|
CCA INDUSTRIES, INC. AND SUBSIDIARIES
NOTES TO CONSOLIDATED FINANCIAL STATEMENTS
NOTE 7 - DEBT AGREEMENT
On December 4, 2015 (the “Closing Date”), CCA Industries, Inc., a Delaware corporation (the “Company”), entered into the Credit and Security Agreement (the “Credit Agreement”) with SCM Specialty Finance Opportunities Funds, L.P., an affiliate of CNH Finance, L.P. The Credit Agreement provides for a line of credit up to a maximum of $5,500,000 (the “Revolving Loan”). The proceeds of the Revolving Loans was used to pay off the Company's existing debt with Capital Preservation Solutions, LLC and for general working capital purposes.
Pursuant to the Credit Agreement, all outstanding amounts under the Revolving Loan bear interest at the 30 day LIBOR rate plus 6% per annum (currently in the aggregate, 6.21% per annum), payable monthly in arrears. The Company is also required to pay a monthly unused line fee and collateral management fee. The commitment under the Credit Agreement expires three years after the Closing Date. The Revolving Loan and all other amounts due and owing under the Credit Agreement and related documents are secured by a first priority perfected security interest in, and lien on, substantially all of the assets of the Company. Amounts available for borrowing under the Line of Credit equal the lesser of the Borrowing Base (as defined below), and $5,500,000, in each case, as the same is reduced by the aggregate principal amount outstanding under the Line of Credit. “Borrowing Base” under the Loan Agreement means, generally, the amount equal to (i) 85% of the Company’s eligible accounts receivable, plus (ii) 65% of the value of eligible inventory, less (iii) certain reserves. The Credit Agreement contains customary representations, warranties and covenants on the part of the Company, including a financial covenant requiring the Company to maintain a fixed charge coverage ratio of no less than 1.0 to 1.0. The Credit Agreement imposes an early termination fee and also provides for events of default, including failure to repay principal and interest when due and failure to perform or violation of the provisions or covenants of the agreement.
On the Closing Date, the Company drew $4,100,000 on the Revolving Loan. Of the amount drawn, $3,721,583 was used to pay the principal amount of $3,700,000 and accrued interest of $21,583 due under the Company's Loan Agreement with Capital Preservation Solutions, LLC described below. The balance of the funds drawn were used to pay certain fees and expenses related to entering into the Credit Agreement, with a balance of $46,032 remitted to the Company. As of November 30, 2017 there was $2,016,355 borrowed on the Revolving Loan.
On September 5, 2014, the Company entered into a Loan and Security Agreement (the “Agreement”) with Capital Preservation Solutions, LLC (“Capital”) for a $5,000,000 working capital line of credit and a term loan for working capital purposes not to exceed $1,000,000. The line of credit and term loan had an interest rate of 6% and matured on December 5, 2015. The line of credit and term loan with Capital were paid in full on December 4, 2015 as described above. The advances made under these loan agreements were subject to a borrowing base calculation that included 80% of the eligible accounts receivable plus 50% of the value of the eligible inventory. All amounts outstanding under these agreements were secured by a first priority security interest in all of the assets of the Company. Capital is owned by Lance Funston, the Chairman of the Board and Chief Executive Officer of the Company, who is also the managing partner of Capital Preservation Holdings, LLC, which owns 19,958 shares of the Company's common stock and all of the Class A common stock. Accordingly, the line of credit and term loan interest expense and cash flow activities are shown, respectively, on the consolidated statements of operations and consolidated statement of cash flows as from a related party.
Contemporaneously with the signing of the Agreement, the Company issued a Warrant to Purchase Common Stock (the “Warrant”) to Capital whereby Capital may acquire upon exercise of the Warrant 1,892,744 shares of the Company’s Common Stock. The Warrant may be exercised in whole or in part at any time during the exercise period which is five years from the date of the Warrant. The Warrant bears a purchase price of $3.17 per share, subject to adjustments. The value of the Agreement was allocated to the relative fair values of the Loan and Security Agreement and Warrant, resulting in an allocation of value to the Warrant of $1,456,400, which was recorded on the financial statements as additional paid-in capital as of September 5, 2014, with an asset of $1,213,667 recorded as deferred financing fees and a reduction of Term Loan- Related Party of $242,733 recorded as debt discount. The deferred
CCA INDUSTRIES, INC. AND SUBSIDIARIES
NOTES TO CONSOLIDATED FINANCIAL STATEMENTS
financing fees and related debt discount were fully amortized as of November 30, 2015. At closing the Company executed a warrant agreement that was exercisable into a variable number of shares. The term was not consistent with the terms agreed to with the lender. The Warrant was corrected in January 2015. The Company has accounted for the transaction as if the corrected Warrant agreement was issued at closing.
NOTE 8 - OTHER INCOME
Other income consists of the following: |
| | | | | | | | | | | | |
| | November 30, |
| | 2017 | | 2016 | | 2015 |
Interest income | | $ | — |
| | $ | 50 |
| | $ | 307 |
|
Royalty income | | 12,000 |
| | 12,000 |
| | 12,000 |
|
Miscellaneous | | 4,836 |
| | 6,460 |
| | 23,298 |
|
Total Other income | | $ | 16,836 |
| | $ | 18,510 |
| | $ | 35,605 |
|
NOTE 9 - 401(K) PLAN
The Company has a 401(K) Profit Sharing Plan for its employees. The plan requires six months of service. Employees must be 21 years or older to participate. Employees may make salary reduction contributions up to 25% of compensation not to exceed the federal government limits. The Plan allows for the Company to make discretionary contributions. The Company in fiscal 2017 began matching the employee contribution up to 3% of their pay. The Company made the following contributions during the 2017, 2016 and 2015 fiscal years:
|
| | | | | | | | | |
| November 30, |
| 2017 | 2016 | 2015 |
Company Contributions | $ | 26,241 |
| $ | — |
| $ | — |
|
NOTE 10 - INCOME TAXES
CCA and its subsidiaries file a consolidated federal income tax return.
The Company previously adopted the provisions of ASC Subtopic 740-10-25, “Uncertain Tax Positions”. Management believes that there were no unrecognized tax benefits, or tax positions that would result in uncertainty regarding the deductions taken, as of November 30, 2017 and November 30, 2016. ASC Subtopic 740-10-25 prescribes a recognition threshold and a measurement attribute for the financial statement recognition and measurement of tax positions taken or expected to be taken in a tax return. For those benefits to be recognized, a tax position must be more-likely-than-not to be sustained upon examination by taxing authorities.
The Company files federal and state income tax returns in jurisdictions with varying statutes of limitations. The 2013 through 2016 tax years remain subject to examination by federal and state tax authorities. The Company is not under examination by any federal and state tax authorities as of November 30, 2017.
The alternative minimum tax, deferred compensation and net operating loss portion of the deferred tax asset has $7,422,331 that has been reclassified as a long-term asset, based on an estimate of the amount that will be realizable in periods greater than twelve months from November 30, 2017. In November 2015, the FASB issued ASU 2015-17, which is an update to Topic 740, "Income Taxes". The update will require that all deferred tax assets and liabilities be classified as non-current. The update is effective for fiscal years, and the interim periods within those years, beginning after December 15, 2016. ASU 2015-17 will have a material impact on the Company's balance sheet, as the deferred tax reported as a current asset will be reported as a non-current asset once the update is effective, resulting in a decrease
CCA INDUSTRIES, INC. AND SUBSIDIARIES
NOTES TO CONSOLIDATED FINANCIAL STATEMENTS
to the Company's current ratio. As of November 30, 2017, the Company reported $2,079,988 of deferred tax as a current asset. The Company will be reporting all deferred tax assets as a non-current asset beginning with the first quarter of fiscal 2018. It is not expected to have a material impact on the Company's results of operations.
At November 30, 2017 and November 30, 2016, respectively, the Company had temporary differences arising from the following:
|
| | | | | | | | | | | | | | | | |
| | November 30, 2017 |
| | | | | | Classified As |
Type | | Amount | | Deferred Tax | | Short-Term
Asset | | Long-Term
Asset |
Depreciation | | $ | (378,580 | ) | | $ | (137,992 | ) | | $ | — |
| | $ | (137,992 | ) |
Reserve for bad debts | | 6,629 |
| | 2,416 |
| | 2,416 |
| | — |
|
Reserve for returns | | 246,513 |
| | 89,854 |
| | 89,854 |
| | — |
|
Accrued returns | | 109,646 |
| | 39,966 |
| | 39,966 |
| | — |
|
Reserve for obsolete inventory | | 158,269 |
| | 57,689 |
| | 57,689 |
| | — |
|
Vacation accrual | | 70,856 |
| | 25,827 |
| | 25,827 |
| | — |
|
Alternative minimum tax carry forward | | — |
| | 122,360 |
| | — |
| | 122,360 |
|
Deferred compensation | | 487,061 |
| | 177,534 |
| | — |
| | 177,534 |
|
Bonus obligations unpaid | | 400,166 |
| | 145,861 |
| | 145,861 |
| | — |
|
Charitable contributions | | 305,633 |
| | 111,403 |
| | 111,403 |
| | — |
|
Section 263A costs | | 48,317 |
| | 17,612 |
| | 17,612 |
| | — |
|
Loss carry forward | | 24,279,259 |
| | 8,849,789 |
| | 1,589,360 |
| | 7,260,429 |
|
Net deferred tax asset | | | | $ | 9,502,319 |
| | $ | 2,079,988 |
| | $ | 7,422,331 |
|
| | |
| | November 30, 2016 |
| | | | | | Classified As |
Type | | Amount | | Deferred Tax | | Short-Term
Asset | | Long-Term
(Liability) |
Depreciation | | $ | (349,763 | ) | | $ | (127,489 | ) | | $ | — |
| | $ | (127,489 | ) |
Reserve for bad debts | | 15,801 |
| | 5,759 |
| | 5,759 |
| | — |
|
Reserve for returns | | 941,228 |
| | 343,078 |
| | 343,078 |
| | — |
|
Accrued returns | | 194,873 |
| | 71,031 |
| | 71,031 |
| | — |
|
Reserve for obsolete inventory | | 500,156 |
| | 182,307 |
| | 182,307 |
| | — |
|
Vacation accrual | | 29,528 |
| | 10,763 |
| | 10,763 |
| | — |
|
Alternative minimum tax carry forward | | | | 20,000 |
| | | | 20,000 |
|
Deferred compensation | | 304,945 |
| | 111,153 |
| | | | 111,153 |
|
Bonus obligations unpaid | | 304,355 |
| | 110,937 |
| | 110,937 |
| | — |
|
Restructuring costs | | 925,000 |
| | 337,163 |
| | 337,163 |
| | — |
|
Charitable contributions | | 584,558 |
| | 213,071 |
| | 96,249 |
| | 116,822 |
|
Section 263A costs | | 79,539 |
| | 28,992 |
| | 28,992 |
| | — |
|
Loss carry forward | | 25,398,347 |
| | 9,257,698 |
| | 962,485 |
| | 8,295,213 |
|
Net deferred tax asset | | | | $ | 10,564,463 |
| | $ | 2,148,764 |
| | $ | 8,415,699 |
|
As a result of the enactment by the United States Government of public law 115-97, an Act to provide for reconciliation pursuant to titles II and V of the concurrent resolution on the budget for fiscal year 2018 (formerly known as the Tax Cut and Jobs Act of 2017), federal corporate tax rates for periods beginning after January 1,
CCA INDUSTRIES, INC. AND SUBSIDIARIES
NOTES TO CONSOLIDATED FINANCIAL STATEMENTS
2018 have been reduced to 21%. The Company's federal rate was previously 34%. This will result in a reduction of the value of the deferred tax assets and a corresponding increase in the provision for income tax to be recorded in the first quarter of fiscal 2018. In addition, ASU 2015-17 is effective with the first quarter of fiscal 2018 and will require that all deferred tax assets be classified as long-term. Please see Note 19, Subsequent Events for further information regarding the effects of the federal corporate tax rate change. Please see Note 2, Accounting Policies, Recent Accounting Pronouncements for further information regarding ASU 2015-17.
The amounts recognized in the deferred tax asset are management's best estimate of the amount more likely than not to be realized and the actual results could differ from those estimates. In determining the amount more likely than not to be realized, management considered all available information. Future profitability in this competitive industry depends on the successful execution of management's initiatives designed to obtain sales levels and improve operating results. The inability to successfully execute these initiatives could reduce estimates of future profitability, which could affect the Company's ability to realize the deferred tax assets. A substantial portion of the deferred tax asset is the loss carry forward as a result of losses incurred by the Company is fiscal 2015 and earlier periods. If the Company does not meet its objectives, it could also result in taking a longer period of time for the net operating loss carry forward to be utilized.
Income tax expense (benefit) is made up of the following components:
|
| | | | | | | | | | | | |
| | November 30, |
Continuing Operations | | 2017 | | 2016 | | 2015 |
Current tax - Federal | | $ | 105,770 |
| | $ | 20,000 |
| | $ | — |
|
Current tax - State & Local | | 5,640 |
| | 28,949 |
| | (2,795 | ) |
Deferred tax expense (benefit) | | 1,062,144 |
| | 899,584 |
| | (1,589,514 | ) |
| | $ | 1,173,554 |
| | $ | 948,533 |
| | $ | (1,592,309 | ) |
|
| | | | | | | | | | | | |
| | November 30, |
Discontinued Operations | | 2017 | | 2016 | | 2015 |
Current tax - Federal | | $ | — |
| | $ | — |
| | $ | — |
|
Current tax - State & Local | | — |
| | — |
| | — |
|
Deferred tax (benefit) expense | | — |
| | (9,126 | ) | | 6,073 |
|
| | $ | — |
| | $ | (9,126 | ) | | $ | 6,073 |
|
Prepaid and refundable income taxes are made up of the following components:
|
| | | | | | | | | | | | |
Prepaid and refundable income taxes | | Federal | | State &
Local | | Total |
November 30, 2017 | | $ | 1,015 |
| | $ | 37,138 |
| | $ | 38,153 |
|
November 30, 2016 | | $ | — |
| | $ | 44,154 |
| | $ | 44,154 |
|
Income tax payable is made up of the following components:
|
| | | | | | | | | | | | |
Income Taxes Payable | | Federal | | State &
Local | | Total |
November 30, 2017 | | $ | — |
| | $ | — |
| | $ | — |
|
November 30, 2016 | | $ | 20,000 |
| | $ | — |
| | $ | 20,000 |
|
CCA INDUSTRIES, INC. AND SUBSIDIARIES
NOTES TO CONSOLIDATED FINANCIAL STATEMENTS
A reconciliation of the (benefit from) provision for income taxes computed at the statutory rate to the effective rate for the three years ended November 30, 2017, 2016 and 2015 is as follows:
|
| | | | | | | | | | | | | | | | | | | | | |
| | | | | | | | | | | | |
| | 2017 | | 2016 | | 2015 |
| | Amount | | Percent of Pretax Income | | Amount | | Percent of Pretax Income | | Amount | | Percent of Pretax Income |
Continuing Operations | | | | | | | | | | | | |
Provision for (benefit from) income taxes at federal statutory rate | | $ | 1,021,610 |
| | 34.00 | % | | $ | 728,014 |
| | 34.00 | % | | $ | (1,648,640 | ) | | 34.00 | % |
Changes in provision for (benefit from) income taxes resulting from: | | | | | | | | | | | | |
State income taxes, net of federal income tax benefit | | 73,616 |
| | 2.45 | % | | 52,460 |
| | 2.45 | % | | (140,619 | ) | | 2.90 | % |
Change in tax rate related to future deferred tax benefits | | — |
| | — | % | | 140,483 |
| | 6.56 | % | | — |
| | — | % |
Non-deductible expenses and other adjustments | | 78,328 |
| | 2.61 | % | | 27,576 |
| | 1.29 | % | | 196,950 |
| | 0.95 | % |
Provision for (benefit from) income taxes at effective rate | | $ | 1,173,554 |
| | 39.06 | % | | $ | 948,533 |
| | 44.30 | % | | $ | (1,592,309 | ) | | 37.85 | % |
|
| | | | | | | | | | | | | | | | | | | | | |
Discontinued Operations | | | | | | | | | | | | |
(Benefit from) provision for income taxes at federal statutory rate | | $ | — |
| | — | % | | $ | (7,004 | ) | | 34.00 | % | | $ | 6,288 |
| | 34.00 | % |
Changes in (benefit from) provision for income taxes resulting from: | | | | | | | | | | | | |
State income taxes, net of federal income tax benefit | | — |
| | — | % | | (505 | ) | | 2.45 | % | | $ | 536 |
| | 2.90 | % |
Non-deductible expenses and other adjustments | | — |
| | — | % | | (1,617 | ) | | 7.85 | % | | (751 | ) | | (4.06 | )% |
(Benefit from) provision for income taxes at effective rate | | $ | — |
| | — | % | | $ | (9,126 | ) | | 44.30 | % | | $ | 6,073 |
| | 32.84 | % |
NOTE 11 - COMMITMENTS AND CONTINGENCIES
Leases
CCA INDUSTRIES, INC. AND SUBSIDIARIES
NOTES TO CONSOLIDATED FINANCIAL STATEMENTS
In April 2015, the Company moved from its facility at 200 Murray Hill Parkway, East Rutherford, New Jersey to a new facility at 65 Challenger Road, Suite 340, Ridgefield Park, New Jersey. The East Rutherford facility consisted of warehouses and offices totaling approximately 81,000 square feet of space. As a result of the outsourcing to the Emerson Group, the Company had not been using the warehouse space since December 2014. The facility at Ridgefield Park is located in an office building and consists of 7,414 square feet of office and allocated common space with an annual rental cost beginning at $159,401 per year. The lease provides for annual rent increases. In addition, the Company pays an electric charge of $1.75 per square foot per year. The lease is for five years and four months, commencing April 10, 2015, and contains a provision for four months of rent at no charge. In June 2015, the Company sub-let the East Rutherford facility. The terms of the sublet is for a monthly rent of $36,963 plus all common charges and utilities for a term of six years and ten and a half months, expiring in May 2022. The sub-lease provides for annual increases of 2% per year. The Company was leasing the East Rutherford facility for $41,931 per month, with annual increases equal to the change in the consumer price index. The Company recorded an expense of $407,094 during fiscal 2015 as a restructuring charge as an estimate for the difference between the rent that the Company pays its landlord and the rent received from the sub-tenant over the term of the sub-lease.
In December 2017, the Company moved from its facility at 65 Challenger Road, Suite 340, Ridgefield Park, New Jersey to a new facility at 1099 Wall Street West, Suite 275, Lyndhurst, New Jersey, as a result of downsizing and not needing as much office space. The suite at Lyndhurst is located in an office building and consists of 1,751 square feet of space including allocated common space. The lease is for three years commencing December 15, 2017, with an annual rent cost of $34,145 for the first eighteen months of the lease and $35,020 for the second eighteen months of the lease. In addition the Company pays an electric charge of $1.75 per square foot per annum. The Company sub-let the Ridgefield Park offices for the remainder of the lease. The sub-let is for annual rent of $126,038 plus all operating expenses and utilities for the term of the sub-lease. The Company will be recording an expense of $94,992 in the first quarter of fiscal 2018 as an estimate for the difference between the rent that the Company pays its landlord and the rent received from the sub-tenant over the term of the sub-lease for the Ridgefield Park facility.
In addition, the Company has entered into various property and equipment operating leases with expiration dates ranging through May 2022.
Future commitments, sub-lease rental income and net commitments under non-cancelable operating lease agreements for each of the next five (5) years and in the aggregate for the years 2022 and thereafter are as follows:
|
| | | | | | | | | |
YEAR ENDING NOVEMBER 30, | Commitments | Sub-lease rental income | Net Commitments |
2018 | $ | 914,766 |
| $ | 790,912 |
| $ | 123,854 |
|
2019 | 933,235 |
| 815,766 |
| 117,469 |
|
2020 | 895,749 |
| 797,791 |
| 97,958 |
|
2021 | 727,106 |
| 704,094 |
| 23,012 |
|
2022 and thereafter | 362,094 |
| 349,426 |
| 12,668 |
|
Royalty Agreements
In 1986, the Company entered into a license agreement with Alleghany Pharmacal Corporation now known as Inspired Beauty Brands, Inc. (the “Inspired Beauty License”). The license agreement, which is for the exclusive rights to Nutra Nail, Hair Off, Properm and IPR-3 was amended in 2011. The Company no longer markets products under the Properm and IPR-3 brand names. The Inspired Beauty License agreement, as amended, requires the Company to pay a royalty rate of 2.5% on net sales of said licensed products, and a minimum royalty of $250,000 per annum.
CCA INDUSTRIES, INC. AND SUBSIDIARIES
NOTES TO CONSOLIDATED FINANCIAL STATEMENTS
The license agreement was further amended to eliminate the minimum royalty payment effective July 1, 2016 and continuing until June 30, 2017. Concurrent during the period that eliminates the minimum royalty, the royalty rate was changed to 10.0% of gross sales. The Company anticipates entering into a revised license agreement that will permanently eliminate the minimum royalty and increase the royalty rate to 10.0% of gross sales. The Company incurred royalties of $64,889 for Alleghany Pharmacal for the fiscal year ended November 30, 2017.
CCA commenced the marketing of its sun-care products line following a May 1998 License Agreement with Solar Sense, Inc. (the “Solar Sense License”), pursuant to which it acquired the exclusive right to use the trademark names “Solar Sense” and “Kids Sense” and to market products associated with those trademarks. The Solar Sense License requires the Company to pay a royalty of 5% on net sales of said licensed products until $2 million total royalties are paid, at which time the royalty rate will be reduced to 1% for a period of twenty-five years. The Company incurred royalties of $8,622 for Solar Sense, Inc. for the fiscal year ended November 30, 2017. Since the contract inception through November 30, 2017, the Company has paid a total of $929,551 in royalties to Solar Sense, Inc.
Effective November 3, 2008, the Company entered into an agreement with Continental Quest Corp., to purchase certain United States trademarks and inventory relating to the Pain Bust*R II business for $285,106 paid at closing. In addition, the Company agreed to pay a royalty equal to 2% of net sales of all Pain Bust*R II products, which are topical analgesics, until an aggregate royalty of $1,250,000 is paid, at which time the royalty payments will cease. The Company incurred royalties of $12 to Continental Quest Corp. for the fiscal year ended November 30, 2017. Since the contract inception through November 30, 2017, the Company has paid a total of $76,119 in royalties to Continental Quest Corp.
On March 23, 2017, the Company entered into a License Agreement (the “Agreement”) with Ultimark Products, Inc. (“Ultimark”) for the exclusive right to manufacture, market and sell the Porcelana brand of skin care products. The Company’s Chairman of the Board and Chief Executive Officer, Lance Funston, is also the Chairman of the Board and Chief Executive Officer of Ultimark. Porcelana is designed to reduce dark spots and brighten the skin. Under the Agreement, the Company acquired the exclusive right and license to use the Porcelana brand, formulas, packaging designs and trademarks (collectively, the “Porcelana Brand”) in connection with the design, development, manufacture, advertising, marketing, promotion, offering, sale and distribution of Porcelana products worldwide. In addition, the Company purchased all good and saleable inventory of Porcelana products in Ultimark's possession or control as of April 1, 2017 at Ultimark's cost without markup. The Agreement has a term of one year, effective April 1, 2017 and ending March 31, 2018. The Agreement may be renewed, at the Company’s option, for up to two additional one-year terms. The Company intends on renewing the Agreement. The Agreement requires the Company to pay Ultimark a royalty of 10% on the gross sales of Porcelana products manufactured and sold under the Agreement. Royalties are payable quarterly, commencing the first fiscal quarter in which Porcelana products are sold pursuant to the Agreement. There is no minimum royalty for any period under the Agreement. In addition, the Company has the option to purchase the Porcelana Brand from Ultimark during the term of the Agreement for an amount not to exceed $3.2 million, subject to a fairness opinion. In the event of such purchase, the Agreement shall thereafter terminate and no further royalties or compensation will be due thereunder. The Company incurred royalties of $137,241for the fiscal year ended November 30, 2017.
The Company is not a party to any other license agreement that is currently material to its operations.
Employment Agreements
On March 21, 2011, the compensation committee of the board of directors, acting on behalf of the Company, entered into an Employment Agreement (each, an “Employment Agreement”) with Stephen A. Heit. Pursuant to his Employment Agreement, Mr. Heit has been engaged to continue to serve as the Company’s Executive Vice President and Chief Financial Officer.
The term of employment under Mr. Heit's Employment Agreement runs from March 21, 2011 through December 31, 2013, and has been continued thereafter for successive one-year periods unless the Company or the Executive chooses not to renew the respective Employment Agreement.
CCA INDUSTRIES, INC. AND SUBSIDIARIES
NOTES TO CONSOLIDATED FINANCIAL STATEMENTS
Under the Employment Agreement, the base salary of Mr. Heit is $250,000 per annum, and may be increased each year at the discretion of the Company’s Board of Directors. Mr. Heit's base salary was increased to $280,000, effective October 1, 2014 and was further increased to $300,000, effective December 31, 2017. Mr. Heit is eligible to receive an annual performance-based bonus under his Employment Agreement, and entitled to participate in Company equity compensation plans. In addition, Mr. Heit receives an automobile allowance, health insurance and certain other benefits.
In the event of termination of the Employment Agreement as a result of the disability or death of the Executive, the Executive (or his estate or beneficiaries) shall be entitled to receive all base salary and other benefits earned and accrued until such termination as well as a single-sum payment equal to the Executive’s base salary and a single-sum payment equal to the value of the highest bonus earned by the Executive in the one-year period preceding the date of termination pro-rated for the number of days served in that fiscal year.
If the Company terminates the Executive for Cause (as defined in the respective Employment Agreement), or the Executive terminates his employment in a manner not considered to be for Good Reason (as defined in the respective Employment Agreement), the Executive shall be entitled to receive all base salary and other benefits earned and accrued prior to the date of termination. If the Company terminates the Executive in a manner that is not for Cause or due to the Executive’s death or disability, the Executive terminates his employment for Good Reason, or the Company does not renew the Employment Agreement after December 31, 2013, the Executive shall be entitled to receive a single-sum payment equal to his unpaid base salary and other benefits earned and accrued prior to the date of termination and a single-sum payment of an amount equal to three times (a) the average of the annual base salary amounts paid to Executive over the three calendar years prior to the date of termination, (b) if less than three years have elapsed between March 21, 2011 and the date of termination, the highest base salary paid to the Executive in any calendar year prior to the date of termination, or (c) if less than twelve months have elapsed between March 21, 2011 and the date of termination, the highest base salary received in any month times twelve. In addition, each Executive is entitled to the same benefits if the Executive terminates his employment with the Company in connection with a Change of Control (as defined in their respective Employment Agreements).
Under the Employment Agreements, the Executive has agreed to non-competition restrictions for a period of six months following the end of the term of his Employment Agreement, during which period the Executive will be paid an amount equal to his base salary for a period of six months, and an amount equal to the pro rata share of any bonus attributable to the portion of the year completed prior to the date of termination. The Executive has also agreed to confidentiality and non-solicitation restrictions under the Employment Agreements.
The foregoing summary of the Employment Agreements are qualified in their entirety by the full text of the Employment Agreement, copies of which may be found in Form 8-K that was filed by Company on March 21, 2011 with the United States Securities and Exchange Commission.
On February 22, 2017, the Company entered into a Severance Agreement with Douglas Haas ("Employee"), the Company's President and Chief Operating Officer. In the event of termination of the Employee's employment as a result of the disability or death of the Employee, the Employee (or his estate or beneficiaries) shall be entitled to receive all base salary and other benefits earned and accrued until such termination as well as a single-sum payment equal to the Employee's base salary and a single-sum payment equal to the value of the highest bonus earned by the Employee in the one-year period preceding the date of termination pro-rated for the number of days served in that fiscal year. If the Company terminates the Employee for Cause (as defined in the Severance Agreement), or the Employee terminates his employment in a manner not considered to be for Good Reason (as defined in the Severance Agreement), the Employee shall be entitled to receive all base salary and other benefits earned and accrued prior to the date of termination. If the Company terminates the Employee in a manner that is not for Cause or due to the Employee’s death or disability or the Employee terminates his employment for Good Reason, the Employee shall be entitled to receive a single-sum payment equal to his unpaid base salary and other benefits earned and accrued prior to the date of termination and a single-sum payment of an amount equal to three times the average of the base salary amounts paid to Employee over the three calendar years prior to the date of termination. In addition, the Employee is entitled to certain benefits in connection with a Change of Control (as defined in the Severance Agreement). The base salary of
CCA INDUSTRIES, INC. AND SUBSIDIARIES
NOTES TO CONSOLIDATED FINANCIAL STATEMENTS
Mr. Haas at the time the Company entered into the Severance Agreement was $275,000 per annum. Effective December 31, 2017, Mr. Haas' base salary was increased to $300,000 per annum.
Under the Severance Agreement, the Employee has agreed to non-competition restrictions for a period of six months following the end of his employment, during which period the Employee will be paid an amount equal to his base salary for a period of six months, and an amount equal to the pro rata share of any bonus attributable to the portion of the year completed prior to the date of termination. The Employee has also agreed to confidentiality and non-solicitation restrictions under the Severance Agreement.
Dividends and Capital Transactions
There were no dividends issued by the Company in fiscal years 2017, 2016 and 2015.
On September 5, 2014, the Company entered into a Loan and Security Agreement (the “Agreement”) with Capital Preservation Solutions, LLC (“Capital”) for a $5,000,000 working capital line of credit and a term loan for working capital purposes not to exceed $1,000,000. Capital Preservation Solutions, LLC is owned by Lance Funston, who also is the managing partner of Capital Preservations Holdings, LLC which owns common stock and all of the Company's Class A common stock. Contemporaneously with the signing of the Agreement, the Company issued a Warrant to Purchase Common Stock (the “Warrant”) to Capital whereby Capital may acquire upon exercise of the Warrant 1,892,744 shares of the Company’s Common Stock. The Warrant may be exercised in whole or in part at any time during the exercise period which is five years from the date of the Warrant. The Warrant bears a purchase price of $3.17 per share, subject to adjustments. The line of credit and term loan with Capital were paid in full on December 4, 2015. See Note 7, Debt Agreement, for further information regarding the Agreement.
NOTE 12 - CONCENTRATION OF RISK
Most of the Company’s products are sold to major drug and food chains merchandisers, and wholesale beauty-aids distributors throughout the United States and Canada.
During the fiscal years ended November 30, 2017, 2016 and 2015, certain customers each accounted for more than 5% of the Company’s net sales, as follows:
|
| | | | | | | | | |
| | For the Year Ended November 30, |
Customer | | 2017 | | 2016 | | 2015 |
Walmart | | 36.3 | % | | 38.7 | % | | 34.6 | % |
Walgreens | | 13.4 | % | | 10.5 | % | | 13.4 | % |
Target | | 6.9 | % | | 8.6 | % | | 7.2 | % |
CVS | | * |
| | * |
| | 5.7 | % |
Foreign Sales | | 12.4 | % | | 11.3 | % | | 13.2 | % |
The loss of any one of these customers could have a material adverse effect on the Company’s earnings and financial position.
During the fiscal years November 30, 2017, 2016 and 2015, certain products within the Company’s product lines accounted for more than 10% of the Company’s net sales as follows:
CCA INDUSTRIES, INC. AND SUBSIDIARIES
NOTES TO UNAUDITED CONSOLIDATED FINANCIAL STATEMENTS
NOTE 12 - CONCENTRATION OF RISK (continued)
|
| | | | | | | | | |
| | For the Year Ended November 30, |
Category | | 2017 | | 2016 | | 2015 |
Skin Care | | 52.6 | % | | 54.0 | % | | 51.9 | % |
Oral Care | | 37.8 | % | | 38.7 | % | | 34.4 | % |
NOTE 13 - RESTRUCTURING
The Company commenced a restructuring plan to reduce expenses and make operations more efficient during fiscal 2014. As part of the plan, the Company reduced its work force from 37 to 20 employees during fiscal 2015. The work force was further reduced to 12 employees during fiscal 2016. The restructuring plan was completed by the end of fiscal 2016. The were no restructuring charges in fiscal 2016 and 2017. The Company incurred facility exit costs of $1,276,477 as a result of exiting and subsequently sub-letting the Company's prior facility at 200 Murray Hill Parkway, East Rutherford, New Jersey in fiscal 2015. The exit costs included writing off leasehold improvements of $714,138, real estate commissions paid for the sub-lease of $155,245 and a charge of $407,094 as an estimate for the difference between the rent that the Company pays its East Rutherford landlord per the master lease and the rent received from the sub-tenant over the term of the sub-lease.
NOTE 14 - DISCONTINUED OPERATIONS
The Company discontinued the Gel Perfect color nail polish business effective as of May 31, 2014. The Gel Perfect brand had declining sales in fiscal 2013 and 2014 prior to the Company determining to discontinue the brand. The Company had increased the total reserve for returns to $3,089,294 as of November 30, 2014 based on the liability with its retail customers for potential returns or mark down agreements. The expense as a result of recording the reserve for returns is reflected as a reduction of net sales for fiscal 2014. As of November 30, 2015, the specific reserve for returns had been fully utilized. The expense recorded for the year ended November 30, 2016 is for a small amount of returns received. The Company does not expect to receive any further returns.
There were no discontinued brand activities in fiscal 2017. The following table summarizes those components of the statement of operations for the discontinued Gel Perfect brand for the years ended November 30, 2016 and 2015:
|
| | | | | | |
| | |
| November 30, |
| 2016 | 2015 |
Net Sales | $ | (20,600 | ) | $ | 17,979 |
|
(Loss) Income before (Benefit from) Provision for Income Taxes | (20,600 | ) | 18,494 |
|
(Benefit from) Provision for Income Tax | (9,126 | ) | 6,073 |
|
Net (Loss) Income | $ | (11,474 | ) | $ | 12,421 |
|
(Loss) Income per Share: | | |
Basic | $ | — |
| $ | — |
|
Diluted | $ | — |
| $ | — |
|
Weighted average shares outstanding | | |
Basic | 7,006,684 |
| 7,006,684 |
|
Diluted | 7,006,684 |
| 7,006,684 |
|
CCA INDUSTRIES, INC. AND SUBSIDIARIES
NOTES TO CONSOLIDATED FINANCIAL STATEMENTS
NOTE 15 - QUARTERLY RESULTS
The following financial data is a summary of the quarterly results of operations (unaudited) during and for the years ended November 30, 2017 and 2016:
|
| | | | | | | | | | | | | | | | |
| | Three Months Ended |
Fiscal 2017 | | Feb. 29 | | May 31 | | Aug. 31 | | Nov. 30 |
Net Sales | | $4,265,078 | | $6,111,836 | | $5,329,753 | | $4,106,595 |
Total Revenue | | 4,269,151 |
| | 6,115,910 |
| | 5,334,368 |
| | 4,110,669 |
|
Cost of Sales | | 1,707,854 |
| | 2,345,980 |
| | 1,989,572 |
| | 1,404,370 |
|
Gross Profit | | 2,557,224 |
| | 3,765,856 |
| | 3,340,181 |
| | 2,702,225 |
|
Income from Continued Operations | | 186,752 |
| | 698,550 |
| | 377,683 |
| | 568,196 |
|
(Loss) Income from Discontinued Operations | | — |
| | — |
| | — |
| | — |
|
Net Income | | 186,752 |
| | 698,550 |
| | 377,683 |
| | 568,196 |
|
Earnings Per Share: | | | | | | | | |
Basic | | | | | | | | |
Continuing Operations | | $ | 0.03 |
| | $ | 0.10 |
| | $ | 0.05 |
| | $ | 0.08 |
|
Discontinued Operations | | $ | — |
| | $ | — |
| | $ | — |
| | $ | — |
|
Total earnings per share | | $ | 0.03 |
| | $ | 0.10 |
| | $ | 0.05 |
| | $ | 0.08 |
|
Diluted | | | | | | | | |
Continuing Operations | | $ | 0.03 |
| | $ | 0.10 |
| | $ | 0.05 |
| | $ | 0.08 |
|
Discontinued Operations | | $ | — |
| | $ | — |
| | $ | — |
| | $ | — |
|
Total earnings per share | | $ | 0.03 |
| | $ | 0.10 |
| | $ | 0.05 |
| | $ | 0.08 |
|
CCA INDUSTRIES, INC. AND SUBSIDIARIES
NOTES TO CONSOLIDATED FINANCIAL STATEMENTS
|
| | | | | | | | | | | | | | | | | |
| | Three Months Ended | |
Fiscal 2016 | | Feb. 28 | | May 31 | | Aug. 31 | | Nov. 30 | |
Net Sales | | $4,680,272 | | $5,675,177 | | $5,036,658 | | $4,218,127 | |
Total Revenue | | 4,684,444 |
| | 5,679,751 |
| | 5,041,193 |
| | 4,223,356 |
| |
Cost of Sales | | 1,814,794 |
| | 2,122,059 |
| | 2,309,056 |
| | 1,912,190 |
| |
Gross Profit | | 2,865,478 |
| | 3,553,118 |
| | 2,727,602 |
| | 2,305,937 |
| |
Income from Continued Operations | | 208,940 |
| | 430,989 |
| | 321,367 |
| | 231,388 |
| |
(Loss) Income from Discontinued Operations | | (5,571 | ) | | (7,312 | ) | | — |
| | 1,409 |
| |
Net Income | | 203,369 |
| | 423,677 |
| | 321,367 |
| | 232,797 |
| |
Earnings Per Share: | | | | | | | | | |
Basic | | | | | | | | | |
Continuing Operations | | $ | 0.03 |
| | $ | 0.06 |
| | $ | 0.05 |
| | $ | 0.03 |
| |
Discontinued Operations | | $ | — |
| | $ | — |
| | $ | — |
| | $ | — |
| |
Total earnings per share | | $ | 0.03 |
| | $ | 0.06 |
| | $ | 0.05 |
| | $ | 0.03 |
| |
Diluted | | | | | | | | | |
Continuing Operations | | $ | 0.03 |
| | $ | 0.06 |
| | $ | 0.05 |
| | $ | 0.03 |
| |
Discontinued Operations | | $ | — |
| | $ | — |
| | $ | — |
| | $ | — |
| |
Total earnings per share | | $ | 0.03 |
| | $ | 0.06 |
| | $ | 0.05 |
| | $ | 0.03 |
| * |
CCA INDUSTRIES, INC. AND SUBSIDIARIES
NOTES TO CONSOLIDATED FINANCIAL STATEMENTS
NOTES TO CONSOLIDATED FINANCIAL STATEMENTS
NOTE 16 - STOCK-BASED COMPENSATION
On June 15, 2005, the shareholders approved an amended and Restated Stock Option Plan amending the 2003 Stock Option Plan (the “2005 Plan”). The 2005 Plan authorizes the issuance of up to one million shares of common stock (subject to customary adjustments set forth in the plan) pursuant to equity awards, which may take the form of incentive stock options, nonqualified stock options restricted shares, stock appreciation rights and/or performance shares. The 2005 Plan expired in April, 2015, but awards made under the 2005 Plan prior to its expiration will remain in effect until such awards have been satisfied or terminated in accordance with the terms and provisions of the 2005 Plan. On August 13, 2015, the shareholders approved the 2015 CCA Industries, Inc. Incentive Plan (the "2015 Plan"). The 2015 Plan authorized the issuance of up to 700,000 shares of common stock (subject to customary adjustments set forth in the plan) pursuant to equity awards, which may take the form of incentive stock options, nonqualified stock options, stock appreciation rights, restricted stock, performance shares and cash awards. On June 7, 2017, the shareholders approved the 2015 CCA Industries, Inc. Incentive Plan as Amended. The sole purpose of the amendment was to increase the shares available for issuance under the 2015 Plan from 700,000 to 1,400,000.
On January 1, 2006, the Company adopted ASC Topic 718, "Stock Compensation" which requires an entity to recognize the grant-date fair value of stock options and other equity-based compensation issued to employees in the financial statements.
The fair value of the stock option grants in fiscal years 2017, 2016 and 2015 were estimated on the date of the grant using a Black-Scholes valuation model and the assumptions in the following table:
|
| | | | | | | |
| Assumptions: |
Option Grant Date | Risk-free Interest Rate | Dividend Yield | Stock Volatility | Option Term (years) |
January 5, 2015 | 1.57 | % | — | % | 37.74 | % | 10 |
April 9, 2015 | 1.40 | % | — | % | 37.79 | % | 10 |
December 1, 2015 | 1.19 | % | — | % | 39.39 | % | 5 |
June 22, 2016 | 1.20 | % | — | % | 36.43 | % | 10 |
June 22, 2016 | 1.20 | % | — | % | 36.43 | % | 5 |
October 5, 2016 | 1.26 | % | — | % | 36.29 | % | 5 |
June 20, 2017 | 1.77 | % | — | % | 36.37 | % | 10 |
October 2, 2017 | 1.31 | % | — | % | 36.73 | % | 5 |
On June 20, 2017, the Company granted incentive stock options for an aggregate of 232,500 shares to ten employees at $3.30 per share, which was the closing price of the Company's stock on that day. The options vest in equal 20% increments beginning one year after the date of grant, and for each of the four subsequent anniversaries of such date. The options expire on June 19, 2027. The Company had estimated the fair value of the options granted to be $369,419 as of the grant date. Accordingly, the Company recorded a charge against earnings in the amount of $30,785 for the fiscal year ended November 30, 2017.
On October 2, 2017, the Company granted non-qualifed stock options for 75,000 shares to Justin W. Mills, III, a director of the Company, at $3.30 per share, which was the closing price of the Company's stock on that day. The options vest twelve months after the date of grant. The options expire on October 1, 2022. The Company had estimated the fair value of the options granted to be $83,813 as of the grant date. Accordingly, the Company recorded a charge against earnings in the amount of $13,969 for the fiscal year ended November 30, 2017.
CCA INDUSTRIES, INC. AND SUBSIDIARIES
NOTES TO CONSOLIDATED FINANCIAL STATEMENTS
NOTES TO CONSOLIDATED FINANCIAL STATEMENTS
A summary of stock option activity for the Company is as follows:
|
| | | | |
| Number of Options | Weighted-Average Exercise Price | Weighted-Average Remaining Term (years) | Aggregate Intrinsic Value |
Outstanding at November 30, 2015 | 104,000 | $3.41 | 7.91 | |
Granted | 519,000 | 3.23 | | |
Exercised | — | — | | |
Canceled or Forfeited | 59,000 | 3.42 | | |
Outstanding at November 30, 2016 | 564,000 | 3.25 | 5.83 | |
Granted | 307,500 | 3.30 | | |
Exercised | — | — | | |
Canceled or Forfeited | — | — | | |
Outstanding at November 30, 2017 | 871,500 | $3.27 | 6.00 | |
Deferred compensation expense recognized for the years ended November 30, 2017, 2016 and 2015 was $167,121, $338,540 and $67,398, respectively.
A summary of the amortization expense of stock options outstanding as of November 30, 2017 is as follows:
|
| | | | |
For the years ended November 30, |
2018 | 2019 | 2020 | 2021 | 2022 |
$202,142 | $132,298 | $119,322 | $98,229 | $43,099 |
The following table summarizes information about currently outstanding and vested stock options at November 30, 2017:
|
| | | |
| | Weighted-Average Remaining Term (years) | |
| Number of Options Granted | Number of Option Shares Vested |
Exercise Price |
$3.03 | 14,000 | 3.85 | 2,800 |
$3.16 | 300,000 | 3.00 | 300,000 |
$3.18 | 10,000 | 7.36 | 4,000 |
$3.30 | 232,500 | 9.56 | — |
$3.30 | 75,000 | 3.56 | 75,000 |
$3.30 | 75,000 | 4.84 | — |
$3.35 | 130,000 | 8.56 | 26,000 |
$3.48 | 35,000 | 7.10 | 14,000 |
Total | 871,500 | | 421,800 |
CCA INDUSTRIES, INC. AND SUBSIDIARIES
NOTES TO CONSOLIDATED FINANCIAL STATEMENTS
NOTES TO CONSOLIDATED FINANCIAL STATEMENTS
NOTE 17 - RELATED PARTY TRANSACTIONS
On September 5, 2014, the Company entered into a Loan and Security Agreement (the “Agreement”) with Capital Preservation Solutions, LLC (“Capital”) for a $5,000,000 working capital line of credit and a term loan for working capital purposes not to exceed $1,000,000. Capital Preservation Solutions, LLC is owned by Lance Funston, who also is the managing partner of Capital Preservations Holdings, LLC which owns common stock and all of the Company's Class A common stock. Contemporaneously with the signing of the Agreement, the Company issued a Warrant to Purchase Common Stock (the “Warrant”) to Capital whereby Capital may acquire upon exercise of the Warrant 1,892,744 shares of the Company’s Common Stock. The Warrant may be exercised in whole or in part at any time during the exercise period which is five years from the date of the Warrant. The Warrant bears a purchase price of $3.17 per share, subject to adjustments. The working capital line of credit and term loan have been recorded on the consolidated balance sheet as of November 30, 2014 as from a related party. Interest and amortized financing costs in the amount of $3,085 was incurred to Capital and is recorded on the consolidated statement of operations for the year ended November 30, 2016 as interest expense from a related party. The working capital and term loan under the Agreement was paid in full on December 4, 2015, and the Agreement expired on December 5, 2015. The warrant remains outstanding.
The Company signed an agreement in December 2014 with Funston Media Management Services, Inc. ("FMM"), which is owned by Lance Funston, who is now the Company's Chairman of the Board and Chief Executive Officer. The agreement provided for FMM to provide consumer advertising purchasing services and brand management for a fee equal to 7.5% of the advertising costs with a minimum fee of $256,200 for the contract period. The agreement also provided for a monthly management fee of $15,000, which was amended to $5,000 per month for the contract period. The agreement ended on November 19, 2015. The Company incurred costs in the amount of $316,200 for the 2015 fiscal year. The Company signed a new agreement in December 2015 with FMM. The agreement provided for FMM to provide consumer advertising purchasing services and brand management for a fee equal to 10.0% of the advertising costs with no minimum fee or monthly management fee. The agreement automatically renews unless canceled by the Company or FMM. Under this new agreement, the Company incurred costs of $80,938 for the year ended November 30, 2017 and $54,509 for the year ended November 30, 2016. As of November 30, 2017, there were unpaid management fees of $199,578 due to FMM.
On March 23, 2017, the Company entered into a License Agreement (the “Agreement”) with Ultimark Products, Inc. (“Ultimark”) for the exclusive right to manufacture, market and sell the Porcelana brand of skin care products. The Company’s Chairman of the Board and Chief Executive Officer, Lance Funston, is also the Chairman of the Board and Chief Executive Officer of Ultimark. Porcelana is designed to reduce dark spots and brighten the skin. Under the Agreement, the Company acquired the exclusive right and license to use the Porcelana brand, formulas, packaging designs and trademarks (collectively, the “Porcelana Brand”) in connection with the design, development, manufacture, advertising, marketing, promotion, offering, sale and distribution of Porcelana products worldwide. In addition, the Company shall purchase all good and saleable inventory of Porcelana products in Ultimark’s possession or control as of April 1, 2017 at Ultimark’s cost, without markup. The Agreement has a term of one year, effective April 1, 2017 and ending March 31, 2018. The Agreement may be renewed, at the Company’s option, for up to two additional one-year terms. The Company intends on renewing the Agreement. The Agreement requires the Company to pay Ultimark a royalty of 10% on the gross sales of Porcelana products manufactured and sold under the Agreement. Royalties are payable quarterly, commencing the first fiscal quarter in which Porcelana products are sold pursuant to the Agreement. There is no minimum royalty for any period under the Agreement. In addition, the Company has the option to purchase the Porcelana Brand from Ultimark during the term of the Agreement for an amount not to exceed $3.2 million, subject to a fairness opinion. In the event of such purchase, the Agreement shall thereafter terminate and no further royalties or compensation will be due thereunder. The Company incurred costs of $137,241 for the year ended November 30, 2017 for royalties under the Agreement. As of November 30, 2017, there were unpaid royalties of $53,822 due to Ultimark.
In June 2017, the Company rented office space at 193 Conshohocken State Road, Penn Valley, Pennsylvania. The Company paid a monthly rental of $1,000 per month during fiscal 2017 commencing June 2017. The rent is
CCA INDUSTRIES, INC. AND SUBSIDIARIES
NOTES TO CONSOLIDATED FINANCIAL STATEMENTS
NOTES TO CONSOLIDATED FINANCIAL STATEMENTS
increased to $2,500 per month for fiscal 2018. The building is owned by Lance Funston, the Company's Chief Executive Officer and Chairman of the Board. The Company's Pennsylvania offices house its marketing and sales staff, as well as the office of the Chief Executive Officer. There is no written lease for the facility.
NOTE 18 - EARNINGS (LOSS) PER SHARE
Basic earnings (loss) per share is calculated using the average number of common shares outstanding. Diluted earnings (loss) per share is computed on the basis of the average number of common shares outstanding plus the effect of outstanding stock options using the “treasury stock method”.
|
| | | | | | | | | | | | |
| | For the Year Ended November 30, |
| | 2017 | | 2016 | | 2015 |
Net income (loss) from continued operations available for common shareholders | | $ | 1,831,181 |
| | $ | 1,192,684 |
| | $ | (3,256,632 | ) |
Net (loss) income from discontinued operations available for common shareholders | | $ | — |
| | $ | (11,474 | ) | | $ | 12,421 |
|
Weighted average common shares outstanding-Basic | | 7,006,684 |
| | 7,006,684 |
| | 7,006,684 |
|
Net effect of dilutive stock options and warrant | | — |
| | 15,080 |
| | — |
|
Weighted average common shares and common shares equivalents—Diluted | | 7,006,684 |
| | 7,021,764 |
| | 7,006,684 |
|
| | | | | | |
Earnings (loss) per Share: | | | | | | |
Basic | | | | | | |
Continuing Operations | | $ | 0.26 |
| | $ | 0.17 |
| | $ | (0.46 | ) |
Discontinued Operations | | $ | — |
| | $ | — |
| | $ | — |
|
Total earnings (loss) per share | | $ | 0.26 |
| | $ | 0.17 |
| | $ | (0.46 | ) |
| | | | | | |
Diluted | | | | | | |
Continuing Operations | | $ | 0.26 |
| | $ | 0.17 |
| | $ | (0.46 | ) |
Discontinued Operations | | $ | — |
| | $ | — |
| | $ | — |
|
Total earnings (loss) per share | | $ | 0.26 |
| | $ | 0.17 |
| | $ | (0.46 | ) |
871,500 shares underlying stock options and 1,892,744 of shares underlying the outstanding warrant for the year ended November 30, 2017, 264,000 of shares underlying stock options for the year ended November 30, 2016 and 1,892,744 of shares underlying the outstanding warrant and 104,000 shares underlying stock options for the year ended November 30, 2015 were excluded from the diluted loss per share because the effects of such shares were anti-dilutive.
CCA INDUSTRIES, INC. AND SUBSIDIARIES
NOTES TO CONSOLIDATED FINANCIAL STATEMENTS
NOTES TO CONSOLIDATED FINANCIAL STATEMENTS
NOTE 19 - SUBSEQUENT EVENTS
On February 5, 2018 the Company entered into the Revolving Credit, Term Loan and Security Agreement (the “Credit Agreement”) with PNC Bank, National Association. The Credit Agreement provides for a term loan in an amount of $1,500,000 (the “Term Loan”) and a revolving line of credit up to a maximum of $4,500,000 (the “Revolving Loan” and together with the Term Loan, the “Loans”). The proceeds of the Loans are to be used to pay off the Company's existing debt with CNH Finance Fund I, L.P., formerly known as SCM Specialty Finance Opportunities Fund, L.P. (“CNH”), and for general working capital purposes. The Term Loan is payable in consecutive monthly installments of $31,250 commencing March 1, 2018 and bears interest, at the election of the Company, at either the PNC base rate plus 1% or 30, 60 or 90 day LIBOR rate plus 3.50%. All outstanding amounts under the Revolving Loan bear interest, at the election of the Company, at either the PNC base rate plus 0.25% or 30, 60 or 90 day LIBOR rate plus 2.75%, payable monthly in arrears. The Company is also required to pay a quarterly unused line fee and collateral management fee. The commitment under the Credit Agreement expires three years after the Closing Date. The Loans and all other amounts due and owing under the Credit Agreement and related documents are secured by a first priority perfected security interest in, and lien on, substantially all of the assets of the Company. Amounts available for borrowing under the Revolving Loan equal the lesser of the Borrowing Base (as defined below), and $4,500,000, in each case, as the same is reduced by the aggregate principal amount outstanding under the Revolving Loan. “Borrowing Base” under the Credit Agreement means, generally, the amount equal to (i) 85% of the Company’s eligible accounts receivable, plus (ii) 65% of the value of eligible inventory, less (iii) certain reserves. The Credit Agreement contains customary representations, warranties and covenants on the part of the Company, including a financial covenant requiring the Company to maintain a fixed charge coverage ratio of no less than 1.10 to 1.0. The Credit Agreement also provides for events of default, including failure to repay principal and interest when due and failure to perform or violation of the provisions or covenants of the agreement, as a result of which amounts due under the Credit Agreement may be accelerated. On the Closing Date, the Company borrowed the entire $1,500,000 Term Loan and drew $386,130 on the Revolving Loan. These amounts were used, in part, to pay off the total amount due under the Company's Credit and Security Agreement with CNH entered into on December 4, 2015. The foregoing description of the Credit Agreement does not purport to be complete and is qualified in its entirety by reference to the Form 8-K filed by the Company with the SEC on February 8, 2018.
As a result of the enactment by the United States Government of public law 115-97, an Act to provide for reconciliation pursuant to titles II and V of the concurrent resolution on the budget for fiscal year 2018 (formerly known as the Tax Cut and Jobs Act of 2017), federal corporate tax rates for periods beginning after January 1, 2018 have been reduced to 21%. The Company's federal rate was previously 34%. The Company values its deferred tax assets and liabilities using the tax rates expected to apply in the years in which those temporary differences are expected to be recovered or settled. The Company, prior to the enactment of public law 115-97, had valued its deferred tax assets and liabilities at a combined federal and state tax rate of 36.45%. Due to the corporate tax rate change, the Company has now determined that its deferred tax assets and liabilities should be valued based on an estimated future tax rate of 26.85%, effective in the first quarter of fiscal 2018. The change in rate will cause the Company to record an additional tax expense as part of the provision for income tax in the first quarter of fiscal 2018 which likely will result in the Company reporting a net loss after provision for income tax for the quarter. In addition, ASU 2015-17 is effective with the first quarter of fiscal 2018 and will require that all deferred tax assets be classified as long-term. The Company as of November 30, 2017 had $2,079,988 of deferred tax assets that were recorded as a current asset.
In December 2017, the Company moved from its facility at 65 Challenger Road, Suite 340, Ridgefield Park, New Jersey to a new facility at 1099 Wall Street West, Suite 275, Lyndhurst, New Jersey, as a result of down sizing and not needing as much office space. The suite at Lyndhurst is located in an office building and consists of 1,751 square feet of space including allocated common space. The lease is for three years commencing December 15, 2017, with an annual rent cost of $34,145 for the first eighteen months of the lease and $35,020 for the second eighteen months of the lease. In addition the Company pays an electric charge of $1.75 per square foot per annum. The Company sub-let the Ridgefield Park offices for the remainder of the lease. The sub-let is for annual rent of $126,038 plus all
CCA INDUSTRIES, INC. AND SUBSIDIARIES
NOTES TO CONSOLIDATED FINANCIAL STATEMENTS
NOTES TO CONSOLIDATED FINANCIAL STATEMENTS
operating expenses and utilities for the term of the sub-lease. The Company will be recording an expense of $94,992 in the first quarter of fiscal 2018 as an estimate for the difference between the rent that the Company pays its landlord and the rent received from the sub-tenant over the term of the sub-lease for the Ridgefield Park facility.
The Company moved its master broker sales representation to Advantage Sales and Marketing ("Advantage", effective January 15, 2018. The Company believes that this change will allow the Company to regain distribution that was lost over the past four years and better implementation of its co-operative advertising programs with the retailers. Advantage currently represents approximately $20 billion in retail sales of consumer products for a number of clients, and is active in the mass market, chain drug, grocery and club channels. Advantage will charge the Company between 3% and 4% of net sales for sales representation. The Company was previously paying the Emerson Group ("Emerson") 3.4% of net sales. In addition, Advantage will be managing the Company's order to cash cycle, including accepting incoming retailer orders, EDI services, coordinating with the warehouse for order picking and shipping, invoicing the order, deduction management and accounts receivable collections. Advantage will charge the Company 1% of cash collections for managing the order to cash cycle. The Company was previously paying Emerson 2% of adjusted gross sales for managing the order to cash cycle. Effective with this change, all cash collections of invoices generated through Advantage will be remitted by the retailer directly to the Company's bank account. Previously the funds were remitted to Emerson's bank account, and the Company had to wait for Emerson to remit the funds to the Company. The Company expects lower gross sales in the first quarter of fiscal 2018 due to the transition to Advantage and the interruption of the order flow, however believes that there will be long term gains that justify the move. The Company also moved its warehousing operations from Geodis Contract Logistics (formerly OHL) to Casestack, Inc., effective January 15, 2018. The Geodis warehouse was located in Plainfield, Indiana. The Casestack, Inc. warehouse is located outside of Scranton, Pennsylvania. The Company expects a small increase in freight out costs to be offset by lower freight in costs.
SCHEDULE II
VALUATION ACCOUNTS
Years Ended November 30, 2017, 2016 and 2015: |
| | | | | | | | | | | | |
COL. A | | COL. B | | COL. C | | COL. D | | COL. E |
| | Balance at
Beginning
Of Year | | Additions
Charged To
Costs and
Expenses | | Deductions | | Balance
At End
Of Year |
Description | | | | | | | | |
Year Ended November 30, 2017: | | | | | | | | |
Allowance for cooperative advertising | | 435,351 |
| | 378,517 |
| | 526,649 |
| | 287,219 |
|
Allowance for doubtful accounts | | 15,801 |
| | 7,233 |
| | 16,405 |
| | 6,629 |
|
Reserve for returns and allowances | | 941,228 |
| | 381,800 |
| | 1,076,515 |
| | 246,513 |
|
| | 1,392,380 |
| | 767,550 |
| | 1,619,569 |
| | 540,361 |
|
Accrual for returns included in accrued liabilities | | 194,873 |
| | 775,170 |
| | 860,397 |
| | 109,646 |
|
Accrual for cooperative advertising in accrued liabilities | | 1,741,402 |
| | 768,503 |
| | 2,387,001 |
| | 122,904 |
|
Reserve for inventory obsolescence | | 500,156 |
| | (112,677 | ) | | 229,210 |
| | 158,269 |
|
Year Ended November 30, 2016: | | | | | | | | |
Allowance for cooperative advertising | | 416,826 |
| | 1,816,804 |
| | 1,798,279 |
| | 435,351 |
|
Allowance for doubtful accounts | | 4,911 |
| | 37,503 |
| | 26,613 |
| | 15,801 |
|
Reserve for returns and allowances | | 907,776 |
| | 2,064,996 |
| | 2,031,544 |
| | 941,228 |
|
| | 1,329,513 |
| | 3,919,303 |
| | 3,856,436 |
| | 1,392,380 |
|
Accrual for returns included in accrued liabilities | | 407,992 |
| | 194,873 |
| | 407,992 |
| | 194,873 |
|
Accrual for cooperative advertising in accrued liabilities | | 1,697,493 |
| | 1,741,402 |
| | 1,697,493 |
| | 1,741,402 |
|
Reserve for inventory obsolescence | | 821,259 |
| | (151,233 | ) | | 169,870 |
| | 500,156 |
|
Year Ended November 30, 2015: | | | | | | | | |
Allowance for cooperative advertising | | 592,202 |
| | 6,704,055 |
| | 6,879,431 |
| | 416,826 |
|
Allowance for doubtful accounts | | 25,124 |
| | 23,536 |
| | 43,749 |
| | 4,911 |
|
Reserve for returns and allowances | | 2,942,543 |
| | 8,927,671 |
| | 10,962,438 |
| | 907,776 |
|
| | 3,559,869 |
| | 15,655,262 |
| | 17,885,618 |
| | 1,329,513 |
|
Accrual for returns included in accrued liabilities | | 653,894 |
| | 407,992 |
| | 653,894 |
| | 407,992 |
|
Accrual for cooperative advertising in accrued liabilities | | 2,368,808 |
| | 1,697,493 |
| | 2,368,808 |
| | 1,697,493 |
|
Reserve for inventory obsolescence | | 992,296 |
| | 952,823 |
| | 1,123,860 |
| | 821,259 |
|