UNITED STATES
SECURITIES AND EXCHANGE COMMISSION
Washington, D.C. 20549
FORM 10-K
Annual Report Pursuant to Section 13 or 15(d) of
the Securities Exchange Act of 1934
For the Fiscal Year Ended November 30, 2015
Commission File Number 001-31643
CCA INDUSTRIES, INC.
(Exact Name of Registrant as specified in Charter)
|
| | |
DELAWARE | | 04-2795439 |
(State or other jurisdiction of incorporation or organization) | | (I.R.S. Employer Identification No.) |
65 Challenger Road, Suite 340, Ridgefield Park, NJ 07660
(Address of principal executive offices, including zip code)
(201) 935-3232
(Registrant’s telephone number, including area code)
Securities registered pursuant to Section 12(b) of the Act:
|
| | |
| | |
Title of class | | Name of each exchange on which registered |
Common Stock, par value $0.01 per share | | New York Stock Exchange: MKT |
Class A Common Stock, par value $0.01 per share | | New York Stock Exchange: MKT |
Securities registered pursuant to Section 12(g) of the Act: NONE
Indicate by check mark if the Registrant is a well-known seasoned issuer, as defined in Rule 405 of The Securities Act. Yes ¨ No ý
Indicate by check mark if the Registrant is not required to file reports pursuant to Section 13 or Section 15(d) of the Act. Yes ¨ No ý
Indicate by check mark whether the Registrant (1) has filed all reports required to be filed by Section 13 or 15 (d) of the Securities Exchange Act of 1934 during the preceding 12 months (or for such shorter period that the Registrant was required to file such reports), and (2) has been subject to such filing requirement for the past 90 days. Yes ý No ¨
Indicate by check mark whether the Registrant has submitted electronically and posted on its corporate website, if any, every interactive data file required to be submitted and posted pursuant to Rule 405 of Regulation S-T (§232.405 of this chapter) during the preceding twelve months (or for such shorter period that the Registrant was required to submit and post such files. Yes ý No ¨
Indicate by check mark if disclosure of delinquent filers pursuant to Item 405 of Regulation S-K is not contained herein, and will not be contained, to the best of Registrant’s knowledge, in definitive proxy or information statements incorporated by reference in Part III of this Form 10-K or any amendment to this Form 10-K. ¨
Indicate by check mark whether the Registrant is a large accelerated filer, an accelerated filer, a non-accelerated filer or a smaller reporting company. See the definitions of “large accelerated filer”, “accelerated filer”and “smaller reporting company” in Rule 12b-2 of the Exchange Act.
|
| | | | | | |
| | | | | | |
Large accelerated filer | | o | | Accelerated filer | | o |
| | | |
Non-accelerated filer | | o | | Smaller reporting company | | ý |
Indicate by check mark whether the Registrant is a shell company (as defined in Rule 12b-2 of the Exchange Act). Yes ¨ No ý
The aggregate market value of the voting stock held by non-affiliates of the Registrant (i.e., by persons other than officers and directors of the Registrant and holders of 10% or more of the Registrant’s voting stock), at the closing sales price of $3.10 on May 29, 2015, was as follows:
|
| | |
| | |
Class of Voting Stock | Market Value |
5,258,718 | shares; Common Stock, $.01 par value | $16,302,026 |
On February 15, 2016 there were 6,038,982 shares of Common Stock and 967,702 shares of Class A Common Stock of the Registrant outstanding. Our Class A Common Stock is held by one holder and is not actively traded.
TABLE OF CONTENTS
PART I
Cautionary Statements Regarding Forward-Looking Statements
Our disclosure and analysis in this report contains forward-looking information that involves risks and uncertainties. Our forward-looking statements express our current expectations or forecasts of possible future results or events, including projections of future performance, liquidity, statements of management’s plans and objectives, future contracts, and forecasts of trends and other matters, and you can identify these statements by the fact that they do not relate strictly to historic or current facts and often use words such as “anticipate”, “estimate”, “expect”, “believe”, “will”, “will likely result”, “plan”, “should”, “outlook”, “plan” “project” and other words and expressions of similar meaning. We can give no assurance that such expectations or forward-looking statements will prove to be correct. An occurrence of or any material adverse change in one or more of the risk factors or risks and uncertainties referred to in this report or included in our other public disclosures or our other periodic reports or other documents or filings filed with or furnished to the SEC could materially and adversely affect our continuing operations and our future financial results, cash flows, available credit, prospects and liquidity. Forward-looking statements speak only as of the date of this filing, and we undertake no obligation to update or revise such statements to reflect new circumstances or unanticipated events or other circumstances affecting such forward-looking statements occurring after the date of this report, even if such results, changes or circumstances make it clear that any forward-looking information will not be realized. Any public statements or disclosures by us following this report which modify or impact any of the forward-looking statements contained in this report will be deemed to modify or supersede such statements in this report. No assurance can be given that the results in any forward-looking statement will be achieved and actual results could be affected by one or more factors, which could cause actual results to differ materially from such forward-looking statements. Factors that may cause actual results to differ materially from those contemplated by such forward-looking statements include those risk factors listed under the “Risk Factors” section of this Annual Report on Form 10-K and other risks and uncertainties identified below.
All of the information concerning our future liquidity, future net sales, margins and other future financial performance and results, achievement of operating plan or forecasts for future periods, sources and availability of credit and liquidity, future cash flows and cash needs, success and results of strategic and operating initiatives, anticipated cost savings and other reduced spending, and other future financial performance or financial position, as well as our assumptions underlying such information, constitute forward-looking information. Our forward-looking statements are based on a series of expectations, assumptions, estimates and projections about the Company, are not guarantees of future results or performance and involve substantial risks and uncertainty, including assumptions and projections concerning our internal operating plan, operating cash flows, liquidity and sources and availability of credit for all forward periods. Our business and our forward-looking statements involve substantial known and unknown risks and uncertainties, including the following risks and uncertainties:
| |
• | the risks associated with our efforts to successfully implement, adjust as appropriate and achieve the benefits of our current strategic initiatives including our outsourcing and restructuring plans and any other future initiatives that we may undertake; |
| |
• | the ability to achieve our operating plan for net sales, working capital and cash flows for fiscal 2016 and 2017; |
| |
• | the ability to access on satisfactory terms, or at all, adequate financing and other sources of liquidity, as and when necessary, to fund our continuing operations, working capital needs, strategic, operating and restructuring initiatives and other cash needs, to obtain an continuation of our credit arrangements with our lender, and to obtain other or additional credit facilities or other internal or external liquidity sources if cash flows from operations and external capital resources are not sufficient for our cash requirements at any time or times; |
| |
• | the satisfaction of all borrowing conditions under our term loan and line of credit, including accuracy of all representations and warranties, no defaults or events of default, absence of material adverse effect or change and all other borrowing conditions, and sufficiency of borrowing base; |
| |
• | the risks associated with our efforts to maintain our customers and expand to attract new customers; |
| |
• | the ability to reduce costs and achieve anticipated cost savings; |
| |
• | continued credit from vendors at existing future expected levels and with acceptable payment terms; |
| |
• | the ability to attract and retain talented and experienced executives that are necessary to execute our initiatives; |
| |
• | the ability to accurately estimate and forecast future selling and other future financial results and financial position; |
| |
• | any impact to or disruption in our supply of merchandise; |
| |
• | the ability to reduce spending as needed. |
The cautionary statements made in this Annual Report on Form 10-K should be read as being applicable to all forward-looking statements whenever they appear in this Annual Report. For these statements, we claim the protection of the safe harbor for forward-looking statements contained in the Private Securities Litigation Reform Act. In addition to the information set forth in this report, you should carefully consider the risk factors and risks and uncertainties included in this report and other periodic reports filed with the SEC.
Item 1. BUSINESS
(a) 2015 Actions
In December of 2013 CCA Management secured Board approval to its plan to restore profitable growth and deliver sustained shareholder value. To realize its overarching goals, management moved determinedly to: (i) an outsourcing and variable cost- business platform, (ii) reducing overhead expenses measurably, (iii) recapitalizing its business and, (iv) concentrating marketing and advertising efforts against its core business units (Plus White, Sudden Change and Bikini Zone) to enhance and leverage each brands equity power among its unique consumer base. The Company completed the outsourcing of its warehouse and support functions during fiscal 2014. The Company has continued its restructuring plan in fiscal 2015 by reducing its work force from 37 to 20 employees during fiscal 2015. The Company has planned for additional personnel to leave during fiscal 2016. The restructuring plan should be complete by the end of the third quarter of fiscal 2016.
(b) General
CCA INDUSTRIES, INC. (hereinafter, “CCA” or the “Company”) was incorporated in Delaware in 1983.
The Company operates in one industry segment, in what may be generally described as fast moving consumer goods, selling numerous products in several health-and-beauty aids over the counter drug and remedies and cosmeceutical categories. All of the Company’s products are manufactured by contract manufacturers, pursuant to the Company’s specifications and formulations.
The Company owns registered trademarks, or exclusive licenses to use registered trademarks, that identify its products by brand-name. Under most of the brand names, the Company markets several different but categorically-related products. The principal brand and trademark names include “Plus+White” (oral health-care products),“Sudden Change” (skin-care products), “Nutra Nail” (nail treatments), “Bikini Zone” (pre and after-shave products), “Hair Off” (depilatories), “Solar Sense” (sun-care products), “Sunset Cafe” (perfumes), “Lobe Miracle” (ear-care product) and “Scar Zone” (scar diminishing cream).
All Company products are marketed and sold to major drug, food chains, mass merchandisers and wholesale beauty aids distributors throughout the United States, as well as internet sales. In addition, certain of the Company’s products are sold internationally, through distributors.
The Company recognizes sales at the time its products are shipped to customers. However, while sales are not formally subject to any contract contingency, returns are accepted if it is in the best interests of the Company’s relationship with the customer. The Company thus estimates ‘unit returns’ based upon a review of the market’s recent-historical acceptance of subject products as well as current market-expectations, and calculates its reserves for estimated returns based on the historical returns as a percentage of sales in the five preceding months, adjusting for returns that can be put back into inventory, and a specific reserve based on customer circumstances, (See "Revenue Recognition" in Note 2 of the consolidated financial statements). Of course, there can be no precise going-forward assurance in respect to return rates and gross margins, and a significant increase in the rate of returns could have a materially adverse effect upon the Company’s financial condition and results of operations.
The Company’s net sales in fiscal 2015 were $24,753,950. Gross profits were $14,308,581. International sales accounted for approximately 13.2% of net sales. The Company had a net loss from continuing operations of $3,256,632 and a net income of $12,421 from discontinued operations, for a total net loss of $3,244,211 for fiscal 2015. Total shareholders' equity at November 30, 2015 was $6,389,141.
Including the principal members of management (see Item 10. Directors, Executive Officers and Corporate Governance), the Company, at November 30, 2015, had a total of 20 employees in the areas of sales, administrative, creative, marketing, accounting, and operations.
(c) Manufacturing and Shipping
The Company creates and/or oversees formulations and arranges with independent contractors for the manufacture of its products pursuant to Company specifications. During fiscal 2015, the Company had research and development costs of $75,208 as compared to $458,984 in fiscal 2014. Manufacturing and component-supply arrangements are maintained with various manufacturers and suppliers. All order processing, invoicing, deduction management and accounts receivable collections are outsourced to The Emerson Group who has contracted for product deliveries with Ozburn-Hessey Logistics, one of the largest integrated global supply chain management companies in the United States (“OHL”), from OHL's managed facility in Indianapolis, Indiana.
(d) Marketing
The Company markets its products to major drug, food and mass-merchandise retail chains, warehouse clubs and leading wholesalers, through independent sales representatives throughout the United States, and through distributors internationally.
The Company sells its products to approximately 383 accounts, most of which have numerous outlets. Approximately 40,000 stores carry at least one Company product (SKU). During the fiscal year ended November 30, 2015, the Company’s largest customers were Wal-Mart (approximately 34.6% of net sales), Walgreens (approximately 13.4%), Target (approximately 7.2%), CVS (approximately 5.7%), and Rite Aid (approximately 4.5%). The loss of any of these principal customers, or substantial reduction of sales revenues realized from their business, could materially and negatively affect the Company’s earnings.
Most of the Company’s products are not particularly susceptible to seasonal-sales fluctuation. However, retail sales of depilatory, shave and sun-care products customarily peak in the spring and summer months.
The Company works with external resources to create media advertising, packaging and point-of-purchase displays.
The Company primarily utilizes national television advertisements to promote its leading brands. On occasion, print and radio advertisements are engaged. In addition, and on a generally continuous basis, store-centered product promotions are co-operatively undertaken with customers.
Each of the Company’s brand-name products is intended to attract a particular demographic segment of the consumer market, and advertising campaigns are directed to the respective market-segments. The Company targets the following demographic segments and utilizes these specific marketing approaches for each of these core brands:
Bikini Zone: Designed to help women relieve the bumps, irritation and redness that can accompany hair removal in the bikini area, the brand is targeted primarily to women aged 18-35 years who remove body hair. Sales volume is seasonal with peak volume occurring between Memorial Day and the July 4th holiday as people prepare for outdoor activity and the swimming season. Marketing efforts are concentrated around this peak season and include in-store displays and secondary placement.
Nutra Nail: Designed to help treat women’s problem nails (weak, brittle), the brand is marketed to women aged 18-54 years, who are concerned about the health and appearance of their nails and cuticles. Nail treatments sales volume tends to be steady throughout the year, while sales volume for nail color tends to experience peak volume during summer months. Marketing efforts have traditionally occurred during all seasons for Nutra Nail treatments. Programs focus around driving in-store consumer trial and include displays, secondary placement and promotional coupons throughout the year.
Plus White: Designed to help consumers whiten their teeth and maintain good oral hygiene, the brand is targeted primarily to women aged 18-49 years, and secondarily to men aged 18-39 years who are concerned about the health and appearance of their teeth. Marketing efforts include national television
advertising, in-store displays and secondary placement, and in-pack cross-promotional coupons throughout the year.
Sudden Change: Designed to help women look their best by reducing the appearance of these signs of aging: wrinkles, dark circles, and dullness. Sudden Change brand is targeted primarily to women, aged 34 years and older. Marketing efforts include national TV advertising, in-store displays and in-pack cross-promotional coupons.
The Company’s in-house marketing personnel are responsible for the creation of its media advertising. Placement is accomplished either directly or through media-service companies.
(e) “Wholly-Owned” Products
The majority of the Company’s sales revenues are from sales of the Company’s “wholly-owned” product lines (i.e., products sold under trademark names owned by the Company, and not subject to any other party’s interest or license), which include principally “Plus+White”, “Sudden Change”, “Bikini Zone”, “Sunset Cafe”, and “Scar Zone”.
(f) All Products
During the fiscal year ended November 30,2015, the Company’s gross sales net of returns by category percentage were: Skin Care 51.9%; Oral Care 34.4%; Nail Care 7.4%; Fragrance 4.2%; Miscellaneous 1.6%; Analgesic 0.5%, and Hair Care 0.0% .
(g) License-Agreements Products
i. Alleghany Pharmacal
In 1986, the Company entered into a license agreement with Alleghany Pharmacal Corporation (the “Alleghany Pharmacal License”). The license agreement, which is for the exclusive rights to Nutra Nail, Hair Off, Properm and IPR-3 was amended in 2011. The Alleghany Pharmacal License agreement, as amended, requires the Company to pay a royalty rate of 2.5% on net sales of said licensed products, and a minimum royalty of $250,000 per annum. The Company incurred the minimum royalty of $250,000 as the royalty incurred was $78,308 for Alleghany Pharmacal for the fiscal year ended November 30, 2015.
ii. Solar Sense, Inc.
CCA commenced the marketing of its sun-care products line following a May 1998 License Agreement with Solar Sense, Inc. (the “Solar Sense License”), pursuant to which it acquired the exclusive right to use the trademark names “Solar Sense” and “Kids Sense” and the exclusive right to market mark-associated products. The Solar Sense License requires the Company to pay a royalty of 5% on net sales of said licensed products until $2 million total royalties are paid, at which time the royalty rate will be reduced to 1% for a period of twenty-five years. The Company incurred royalties of $44,563 for Solar Sense, Inc. for the fiscal year ended November 30, 2015. Since the contract inception through November 30, 2015, the Company has incurred a total of $895,746 in royalties to Solar Sense, Inc.
iii. Continental Quest Corp.
Effective November 3, 2008, the Company entered into an agreement with Continental Quest Corp., to purchase certain United States trademarks and inventory relating to the Pain Bust*R II business for $285,106 paid at closing. In addition, the Company agreed to pay a royalty equal to 2% of net sales of all Pain Bust*R II products, which are topical analgesics, until an aggregate royalty of $1,250,000 is paid, at which time the royalty payments will cease. The Company incurred royalties to Continental Quest Corp. totaling $2,924 for the fiscal year ended November 30, 2015. Since contract inception through November 30, 2015, the Company has incurred a total of $75,151 in royalties to Continental Quest Corp.
iv. Joann Bradvica
On March 22, 2002, the Company entered into an agreement with Joann Bradvica, granting the Company an exclusive license to manufacture and sell an Earlobe Patch Support for Earrings. The agreement provided for a royalty of 10% of net sales of the licensed product. A new agreement was entered into and effective on June 8, 2009 at the same royalty rate, and provides for a minimum royalty of $40,000 for annual periods beginning July 1, 2009 in order to maintain the license. The royalty agreement terminated upon the expiration of the licensor's patent on April 15, 2015. The Company incurred royalties of $25,320 to Joann Bradvica for the fiscal year ended November 30, 2015.
vi. Other Licenses
The Company is not party to any other license agreement that is currently material to its operations.
(h) Trademarks
The Company’s own trademarks and licensed-use trademarks serve to identify its products and proprietary interests. The Company considers these marks to be valuable assets. However, there can be no assurance, as a practical matter, that trademark registration results in marketplace advantages, or that the presumptive rights acquired by registration will necessarily and precisely protect the presumed exclusivity and asset value of the marks.
(i) Competition
The market for fast moving consumer goods, in general, is characterized by vigorous competition among producers, many of whom have substantially greater financial, technological and marketing resources than the Company. Major competitors such as Revlon, L’Oreal, Colgate-Palmolive, Coty, Unilever, and Procter & Gamble have the broadest-based public recognition of their products and are significantly larger than us. Moreover, a substantial number of other health-and-beauty aids manufacturers and distributors may also have greater resources than the Company. In order to successfully compete with larger and better funded brands, the Company employs a strategy of uncovering unmet niche needs within large categories, then developing products specifically designed to address those needs. For example, our Sudden Change Under Eye Firming Serum platform claim is that it can produce a faster result than leading competitive products. Our marketing strategy seeks to employ highly efficient media buying and direct to consumer techniques to create awareness in the most cost efficient manner possible.
(j) Sources and Availability of Raw Materials and Principal Suppliers
The Company does not manufacture any of its products and instead uses contract manufacturers to produce its products. In some cases the Company provides raw materials and packaging materials to the contract manufacturer, and in some cases the contract manufacturer sells the Company a turn-key (complete) product. The Company's contract manufacturers produce product based on written purchase orders submitted which specify a quantity of product to be produced. If a particular contract manufacturer was unable to continue producing product for the Company, the Company believes that it could change to an alternate supplier, and depending upon the timing and particular circumstances, this change would not adversely impact the Company’s business or operations.
The Company does not have a written contract with any of the suppliers of its raw materials. The suppliers of raw materials fulfill orders based on a written purchase order specifying the quantity of raw materials to be supplied. The Company purchases raw materials from a variety of suppliers and is not dependent on any one supplier. The Company believes that the raw materials in its products are commonly available and that there is no material risk as to its ability to obtain future supplies of such materials.
(k) Government Regulation
All of the products that the Company markets are subject or potentially subject to particular regulation by government agencies, such as the U.S. Food and Drug Administration (“FDA”), the Federal Trade Commission, and various state and/or local regulatory bodies. In the event that any future regulations were to require new approval for any in-the-market products, or should require approval for any planned product, the Company would attempt to obtain the necessary approval and/or license, assuming reasonable and sufficient market expectations for the subject product. However, there can be no assurance, that Company efforts in respect of any future regulatory requirements would result in approvals and issuance of licenses. Moreover, if such license-requirement circumstances should arise, delays
inherent in any application-and-approval process, as well as any refusal to approve, could have a material adverse effect upon the Company's financial condition and existing operations (i.e. concerning in-the-market products) or planned operations.
(l) Cost and Effects of Compliance with Environmental Laws
The costs and effects of compliance with environmental laws are not material to the Company.
Item 1A. RISK FACTORS
Concentration of Risk.
The Company relies on mass merchandisers and major food and drug chains for the sales of its products. The loss of any one of those accounts or substantial reduction of sales revenues realized from their business could have a material negative impact upon our financial condition and results of operations. All of the Company’s products have independent and substantial competition and must be able to effectively compete in order to maintain the Company's position on the retail merchandisers’ shelves. (See Business—General, Item 1 (c) Marketing.)
We are Dependent on Independent Contract Manufacturers.
The Company does not manufacture any of its products. All of the products are manufactured for the Company by independent contract manufacturers. There can be no assurance that these independent contract manufacturers will manufacture our products in the time, in accordance with our specifications or at the level of quality expected. There can be no assurance that the failure of a supplier to deliver the products ordered by the Company, when requested, will not cause burdensome delays in the Company’s shipments to its customers. The Company does constantly seek alternative suppliers should a major supplier fail to deliver as contracted. A failure of the Company to ship as ordered by its customers could cause penalties and/or cancellations of our customers’ orders. In addition, an unanticipated need to transition to a new supplier could result in delays that could impact timely distribution of our products. Any of the foregoing events, depending upon the timing and particular circumstances, could have a material adverse impact on our relationships with our customers and our results of operations, financial condition and business.
There is No Assurance That The Business Will Be Able to Operate Profitably.
In fiscal 2015, net sales were $24,753,950 with a net loss from continuing operations of $3,256,632 and a net gain from discontinued operations of $12,421, for a total net loss of $3,244,211. There is no assurance that the Company’s products will be successful or that its future operations will be profitable.
We may experience periods of declines in sales, especially during periods of economic downturn, and any material reduction in our sales could have a material adverse impact on our results of operations, financial condition and business.
Additional risk factors for consideration:
We continue to execute our turnaround strategy and there is no assurance that our sales trends and operating results may not take longer to recover than planned, which would impact our future operating results and cash flows.
Our operating plan contemplates improvement in our operating results for 2016 and beyond. We are in a turnaround, our initiatives designed to improve our sales and operating results are still in the early stages which adds challenges and uncertainty, and we incurred a significant operating loss in fiscal 2014 and 2015. There can be no assurance that our past sales trends and operating results may not continue longer than we expect or may take longer to recover than we have planned or that we will achieve our operating plan, which would negatively impact revenues, operating results and cash flows. There is no assurance that our cash from operations and credit from external sources will at all times be sufficient for all of our operating requirements and other cash requirements. If this were to occur, we would closely monitor our operating performance and our liquidity and take actions designed to improve our liquidity and mitigate any shortfall and potentially seek other or additional financing and seek to take other actions, although there can be no assurance that any of these actions would be successful or that any such additional liquidity, if needed, would be available or obtainable on sufficient or favorable terms, which would materially and adversely affect our operating results, liquidity, financial position and business.
We depend on our existing credit facility, which is based on eligible accounts receivable and inventory.
On December 4, 2015 (the “Closing Date”), CCA Industries, Inc., a Delaware corporation (the “Company”), entered into the Credit and Security Agreement (the “Credit Agreement”) with SCM Specialty Finance Opportunities Funds, L.P., an affiliate of CNH Finance, L.P (together "SCM"). The Credit Agreement provides for a line of credit up to a maximum of $5,500,000 (the “Revolving Loan”). The Revolving Loan and all other amounts due and owing under the Credit Agreement and related documents are secured by a first priority perfected security interest in, and lien on, substantially all of the assets of the Company. Amounts available for borrowing under the Line of Credit equal the lesser of the Borrowing Base (as defined below), and $5,500,000, in each case, as the same is reduced by the aggregate principal amount outstanding under the Line of Credit. “Borrowing Base” under the Loan Agreement means, generally, the amount equal to (i) 85% of the Company’s eligible accounts receivable, plus (ii) 65% of the value of eligible inventory, less (iii) certain reserves. If the Company does not have sufficient eligible accounts receivable and inventory, the ability to borrow under the Credit Agreement may be reduced. The Credit Agreement contains customary representations, warranties and covenants on the part of the Company, including a financial covenant requiring the Company to maintain a fixed charge coverage ratio of no less than 1.0 to 1.0. The Credit Agreement imposes an early termination fee and also provides for events of default, including failure to repay principal and interest when due and failure to perform or violation of the provisions or covenants of the agreement. Upon the occurrence of an event of default, SCM may elect to declare the entire unpaid principal balance of the term loan and line of credit to be immediately due and payable, together with interest and all costs incurred by SCM under the loan agreement. Our ability to make payments on our indebtedness and to fund planned capital expenditures and development efforts will depend on our ability to achieve the anticipated benefits of our outsourcing and restructuring plan and our ability to generate cash in the future from our operations which cannot be assured. These items, to a certain extent, are dependent upon industry conditions, as well as general economic, financial, competitive, legislative, regulatory and other factors, many of which are beyond our control.
The Company is Dependent on Outsourced Core Function Vendors
In the first quarter of fiscal 2014, management approved and began implementing the Company's outsourcing agreements with the Emerson Group, which includes sales, customer service, accounts receivable collection functions, warehousing and shipping functions. While there are other vendors that provide these services, which could be sought as alternative vendors, any disruption in our sales, shipments, collections or any other core outsourced function, could have a material adverse effect on the Company's financial condition, results of operations and business.
The Fast Moving Consumer Goods Segment is Highly Competitive.
The market for cosmetics and perfumes, and health-and-beauty aids products in general, including patent medicines, is characterized by vigorous competition among producers, many of whom have substantially greater financial, technological and marketing resources than the Company. Major competitors such as Revlon, L’Oreal, Colgate-Palmolive, Coty, Unilever, and Procter & Gamble have the broadest-based public recognition of their products and are significantly larger than the Company. Moreover, a substantial number of other health-and-beauty aids manufacturers and distributors may also have greater resources than the Company and may therefore have the ability to spend more aggressively on research and development, advertising and marketing, and to respond more effectively to changing business and economic conditions. Our inability to successfully compete with our competitors could have a material adverse effect on the Company's financial condition, results of operation and business.
Our Class A Shareholders Retain Control of Board of Directors.
Class A Shareholder, Capital Preservation Holdings, LLC has the right to elect four members to the Board of Directors. Capital Preservation Holdings, LLC is controlled by Lance Funston, the Company's Chairman of the Board and Chief Executive Officer, and as a result, able to exert significant influence over our business. The holders of Common Stock have the right to elect three members to the Board of Directors.
Future Success Depends on Continued Success of the Company’s Current Products and New Product Development.
The Company is not financially as strong as the major companies against whom it competes. The ability to successfully introduce new niche products and increase the growth and profitability of its current and new niche brand products will affect the business and prospects of the future of the Company and this ability is dependent upon the creativity and marketing skills of management and its advisors and business partners.
All of the Company’s product must be in compliance with all FDA and state regulations and all products which are being manufactured for the Company by outside suppliers must conform to the FDA’s Good Manufacturing Practices requirements. It is the Company’s responsibility to ascertain that the suppliers conform with these requirements. Damage could be caused to our reputation and our relationships with our customers and consumers if our products do not comply with such legal requirements, or with consumer expectations, which could result in diminished sales or liability claims, either of which could have a material adverse impact on our results of operations, financial condition and business.
The Company Relies On A Few Large Customers For A Significant Portion Of Its Sales.
In fiscal 2015, Wal-Mart Stores Inc. represented 34.6% of the Company’s net sales. The Company’s five largest customers accounted for 65.5% of the Company’s net sales. The Company has no agreements with any of its customers to stock its products. The Company’s business would suffer materially if it lost Wal-Mart Stores, Inc. as a customer. The loss of any significant reduction in sales to any of the Company’s five top customers could likely have a material adverse effect on the Company’s financial condition and results of operations.
The Price of the Company’s Stock May Be Volatile.
The Company’s stock could fluctuate substantially. There is a limited float of shares tradable. There are factors beyond the Company’s control which may cause the market price of our stock to fluctuate significantly, including but not limited to the volatility of small cap stocks in general, general stock market conditions, and general economic variations. In addition, variations in the Company’s operating revenues and profits and the timing of advertising commitments also may have an effect on the market price of the Company’s stock.
Climate Change Effects.
The Company continues to monitor climate changes for any potential impact on its business. At this time, the Company does not anticipate that any climate change or climate change regulations will have a material impact on its operations or business.
The Company May Experience Interruptions to Its Business Operations Due to Events Beyond Its Control
A catastrophic event beyond the Company’s control, such as a natural disaster, health pandemic, cyber attack, adverse weather event or act of terrorism, that results in the destruction or disruption of any of the Company’s critical business systems or operations could harm its ability to conduct normal business operations and its operating results.
We Depend on Key Personnel.
Our employees are key to the growth and success of our business. This depends, in large part, on our ability to attract, retain and motivate qualified personnel, including our executive officers and key management personnel. If we are unable to attract and retain key personnel, our operating results could be adversely affected.
The Future Growth of the Company Depends on an Effective Marketing Program.
An effective marketing program includes media advertising, in-store merchandising and enhancing distribution, co-operative advertising with our retail partners and product promotions that increase product availability, awareness, and help generate increased sales for our customers. Our inability to develop and implement effective advertising campaign, marketing or promotional programs, that will succeed in a difficult economic environment and highly competitive marketplace, could have a material adverse effect on our business.
We Sell to International Accounts.
In fiscal 2015, international sales accounted for approximately 13.2% of our total net sales with shipments to our Canadian distributor accounting for approximately 1.6% of our total net sales. Our international sales expose the Company to additional risks associated with political or regulatory conditions, the dependence on other economies and foreign currency fluctuations which may diminish demand for U.S. goods and subject us to adverse translation impact. A terrorist attack, the threat of a terrorist attack or foreign military operations or other catastrophic event beyond the Company's control could prevent us from shipping to our international accounts. A loss of or material reduction in our international sales would have a material adverse effect on our business.
We Purchase Some Raw Materials or Components from International Suppliers.
Some of the components used in our products are sourced from international suppliers either by the Company directly or through our outside contract manufacturers. This exposes the Company to an additional risk of increased costs if the foreign currency exchange rates change unfavorably. A terrorist attack, the threat of a terrorist attack or foreign military operations or other catastrophic event beyond the Company's control could prevent the international suppliers from delivering their goods to the Company or contract manufacturers. The interruption of the supply could have a material adverse effect on our business.
We Have Entered into Employment and Change of Control Agreements that would Require Us to Make Substantial Payments in connection with a Change of Control of the Company.
The Company has entered into Employment Agreements with Stephen A. Heit, the Company's Chief Financial Officer ("the Executive") and one other employee. The Employment Agreements may, in the event of termination of employment under certain circumstances or a change of control of the Company, result in a lump sum payment equal to three times the Executive’s base annual salary and prior year bonus plus other benefits. As a result, if the Company was required to make a substantial payment to the Executives under these agreements, there would be a significant impact on the Company’s cash reserves and earnings. For further information, see Part III, Section 11, Executive Compensation.
The Company May Not be Able to Fully Realize its Deferred Tax Assets.
The amounts recognized in the deferred tax asset are management's best estimate of the amount more likely than not to be realized and the actual results could differ from those estimates. In determining the amount more likely than not to be realized, management considered available information and determined the negative objective evidence, primarily recent losses offset by positive objective evidence, including the effects of current year restructuring expenses that will not recur, the savings of the related payroll and rent expense resulting from the restructuring and forecasts for future profitability. Future profitability in this competitive industry depends on the successful execution of management's initiatives designed to obtain sales levels and improve operating results. The inability to successfully execute these initiatives could reduce estimates of future profitability, which could affect the Company's ability to realize the deferred tax assets.
Item 1B. UNRESOLVED STAFF COMMENTS
None
Item 2. PROPERTIES
In April 2015, the Company moved from its facility at 200 Murray Hill Parkway, East Rutherford, New Jersey to a new facility at 65 Challenger Road, Suite 340, Ridgefield Park, New Jersey. The East Rutherford facility consisted of warehouses and offices totaling approximately 81,000 square feet of space. As a result of the outsourcing to the Emerson Group, the Company had not been using the warehouse space since December 2014. The facility at Ridgefield Park is located in an office building and consists of 7,414 square feet of office and allocated common space with an annual rental cost of $154,458 plus annual increases. Included in the annual rental cost is an electric charge of $1.75 per square foot per year. The lease is for five years and four months, commencing April 10, 2015, and contains a provision for four months of rent at no charge.
In June 2015, the Company sub-let the East Rutherford facility. The terms of the sublet is for a monthly rent of $36,963 plus all common charges and utilities for a term of six years and ten and a half months, expiring in May 2022. The sub-lease provides for annual increases of 2% per year. The Company's lease for the East Rutherford facility provides for rent currently of $41,973 per month, with annual increases equal to the change in the consumer price index. The lease expires in May 2022.
Item 3. LEGAL PROCEEDINGS
On February 3, 2015, plaintiff Anthony E. Held brought an action in Marin County Superior Court (the "State Court Action") against the Company and other defendants. The complaint alleges violation of California's Proposition 65 with regard to the Company's sunscreen product Solar Sense. The Action was subsequently consolidated into Lead Case No. CIV-1402798 in Marin County Superior Court. On April 2, 2015, the Company answered the Complaint denying each and every allegation and asserting several affix native defenses. Limited discovery has been taken. The parties are in the process of mediation, which has been scheduled to occur in March 2016. The Company believes that the allegations are without merit and intends to vigorously defend the case. However, there can be no assurance that our position will be upheld.
On August 4, 2015, SHEFA LMV, LLC (a California organization) amended a complaint previously filed on April 17, 2015 in Los Angeles County Superior Court, naming CCA Industries as a Doe defendant in a Proposition 65 case coordinated in Alameda County Superior Court, regarding the Company's product Pain Bust*R II. On September 18, 2015, the Company answered the Complaint denying each and every allegation and asserted twelve affirmative defenses. No discovery has been taken to date. Plaintiff is in the process of settlement with various defendants. Court has set a further Case Management Conference on March 17, 2016. The Company believes that the allegations are without merit and intends to vigorously defend the case. However, there can be no assurance that our position will be upheld.
We are involved from time to time in routine legal matters and other claims incidental to our business. We review outstanding claims and proceedings internally and with external counsel as necessary to assess probability and amount of potential loss. These assessments are re-evaluated at each reporting period and as new information becomes available to determine whether a reserve should be established or if any existing reserve should be adjusted. The actual cost of resolving a claim or proceeding ultimately may be substantially different than the amount of the recorded reserve. In the opinion of management, our financial condition, results of operations, and liquidity should not be materially affected by the outcome of such legal proceedings and claims.
Item 4. MINE SAFETY DISCLOSURES
Not applicable.
PART II
Item 5. MARKET FOR REGISTRANT’S COMMON EQUITY, RELATED SHAREHOLDER MATTERS AND ISSUER PURCHASES OF EQUITY SECURITIES
The Company’s Common Stock is traded on the New York Stock Exchange MKT under the symbol “CAW”.
The Company’s Class A Common Stock is listed, but not traded, on the New York Stock Exchange MKT.
The range of high and low sales prices of the Company's Common Stock during each quarter of its 2015 and 2014 fiscal years were as follows:
|
| | | | |
Quarter Ended | | 2015 | | 2014 |
February 28 | | $3.64—$3.18 | | $3.28—$2.94 |
May 31 | | $3.45—$2.95 | | $3.27—$3.00 |
August 31 | | $3.19—$2.11 | | $4.09—$2.92 |
November 30 | | $3.88—$2.50 | | $3.59—$3.04 |
The high and low sales prices for the Company’s Common Stock, on February 18, 2016 were $3.30—$3.24 per share.
As of February 17, 2016, there were approximately 127 individual shareholders of record of the Company’s Common Stock. Based on reports of security position listings and the number of proxies requested by brokers in conjunction with the prior year’s annual meeting of stockholders, we believe there are a substantial number of beneficial holders in various street and depository trust accounts, which represent approximately 1,000 additional shareholders.
As of February 17, 2016, there was one individual shareholder of record of the Company’s Class A Common Stock.
The dividend policy is at the discretion of the Board of Directors of the Company and will depend on numerous factors, including earnings, financial requirements and general business conditions. Additionally, the debt instruments to which we are a party impose restrictions that significantly restrict us from making dividends or distributions. We did not pay any dividends in fiscal years 2015 and 2014, and we currently intend to retain all available funds and any future consolidated earnings to fund our operations and the development and growth of our business.
Unregistered Sales. During fiscal 2015, we issued the following equity grants to certain employees without registration in reliance on an applicable exemption from registration under Section 4(a)(2) and Regulation D of the Securities Act: On January 5, 2015, the Company granted incentive stock options for 175,000 shares to eight employees of the Company at 3.48 per share. The closing price of the Company's stock on the date of the grant was 3.48 per share. The options vest in equal 20% increments commencing one year after the date of grant, and for each of the four subsequent anniversaries of such date. The options expire on January 5, 2025. The Company had estimated the fair value of the options granted to be $297,833 as of the grant date. Subsequent to the grant date, 130,000 incentive stock option shares were forfeited, which had a fair market value of $221,247 at the time of the grant. The balance of 45,000 shares outstanding from the January 5, 2015 grant with a fair market value of $76,586 is being amortized as an expense over a five year period. Accordingly, the Company recorded a charge against earnings in the amount of $14,041 for the fiscal year end November 30, 2015.
On April 9, 2015, the Company granted incentive stock options for 10,000 shares to an employee of the Company, at $3.18 per share. The closing price of the Company's stock on the date of grant was $3.18 per share. The options vest in equal 20% increments commencing one year after the date of grant, and for each of the four subsequent anniversaries of such date. The options expire on April 8, 2025. The Company has estimated the fair value of the options granted to be $15,418 as of the grant date, which amount shall be amortized as an expense over a five year period. Accordingly, the Company recorded a charge against earnings in the amount of $2,056 for the fiscal year end November 30, 2015.
Item 6. SELECTED FINANCIAL DATA
|
| | | | | | | | | | | | | | | | | | | | |
| | Years Ended November 30, |
| | 2015 | | 2014 | | 2013 | | 2012 | | 2011 |
Statement of Operations: | | | | | | | | | | |
Sales, Net | | $ | 24,753,950 |
| | $ | 30,120,299 |
| | $ | 28,763,369 |
| | $ | 32,340,314 |
| | $ | 32,216,380 |
|
(Loss) from Continuing Operations | | (3,256,632 | ) | | (2,803,428 | ) | | (3,511,282 | ) | | (3,065,470 | ) | | (2,281,977 | ) |
Income (Loss) from Discontinued Operations | | 12,421 |
| | (5,996,041 | ) | | (2,681,966 | ) | | 3,530,922 |
| | 2,773,675 |
|
Net (Loss) Income | | (3,244,211 | ) | | (8,799,469 | ) | | (6,193,248 | ) | | 465,452 |
| | 491,698 |
|
(Loss) Earnings Per Share: | | | | | | | | | | |
Basic | | | | | | | | | | |
Continuing Operations | | $ | (0.46 | ) | | $ | (0.40 | ) | | $ | (0.50 | ) | | $ | (0.43 | ) | | $ | (0.32 | ) |
Discontinued Operations | | — |
| | $ | (0.86 | ) | | $ | (0.38 | ) | | $ | 0.50 |
| | 0.39 |
|
Diluted | | | | | | | | | | |
Continuing Operations | | $ | (0.46 | ) | | $ | (0.40 | ) | | $ | (0.50 | ) | | $ | (0.43 | ) | | $ | (0.32 | ) |
Discontinued Operations | | $ | — |
| | $ | (0.86 | ) | | $ | (0.38 | ) | | $ | 0.50 |
| | $ | 0.39 |
|
Weighted Average Number of Shares Outstanding—Basic | | 7,006,684 |
| | 7,006,684 |
| | 7,037,694 |
| | 7,054,442 |
| | 7,054,442 |
|
Weighted Average Number of Shares Outstanding—Diluted | | 7,006,684 |
| | 7,006,684 |
| | 7,037,694 |
| | 7,054,442 |
| | 7,054,442 |
|
|
| | | | | | | | | | | | | | | | | | | | |
| | At November 30, |
Balance Sheet Data: | | 2015 | | 2014 | | 2013 | | 2012 | | 2011 |
Working Capital | | $ | (2,474,868 | ) | | $ | 900,826 |
| | $ | 12,911,553 |
| | $ | 22,668,426 |
| | $ | 21,557,320 |
|
Total Assets | | 19,150,559 |
| | 21,732,592 |
| | 26,345,749 |
| | 35,271,109 |
| | 34,905,527 |
|
Total Liabilities | | 12,761,418 |
| | 12,166,638 |
| | 9,283,383 |
| | 11,023,133 |
| | 9,297,476 |
|
Total Shareholders’ Equity | | 6,389,141 |
| | 9,565,954 |
| | 17,062,366 |
| | 24,247,976 |
| | 25,608,051 |
|
Cash Dividends Declared per Common Share | | $ | — |
| | $ | — |
| | $ | 0.14 |
| | $ | 0.28 |
| | $ | 0.28 |
|
Item 7. MANAGEMENT’S DISCUSSION AND ANALYSIS OF FINANCIAL CONDITION AND RESULTS OF OPERATIONS
Reference is made to “Item 1A. Risk Factors” and “Cautionary Statements Regarding Forward-Looking Statements” which describe important factors that could cause actual results to differ materially from expectations and non-historical information contained herein. In addition, the following discussion should be read in conjunction with our financial statements and the notes to those statements and other financial information appearing elsewhere in this report.
Overview
For the year ended November 30, 2015, the Company had a net loss from continuing operations of $3,256,632 and a loss per share, basic and fully diluted of $0.46 , as compared to a net loss from continuing operations of $2,803,428 and a loss per share, basic and fully diluted of $0.40 for the year ended November 30, 2014. For the year ended November 30, 2015 the Company had net income from discontinued operations of $12,421, and earnings per share, basic and fully diluted of $0.00 as compared to a net loss from discontinued operations of $5,996,041, and loss per
share, basic and fully diluted, of $0.86 for the same period in fiscal 2014. The total of continuing and discontinued operations for the year ended November 30, 2015 was a net loss of $3,244,211 compared to a net loss of $8,799,469 for the year ended November 30, 2014.
The Company has continued the restructuring plan that it begun in fiscal 2014. During fiscal 2015, the Company reduced its staffing from 37 to 20 employees. The Company's restructuring plan includes further personnel reductions in fiscal 2016. The Company expects its restructuring plan to be complete by the end of the third quarter of fiscal 2016. As part of the plan, the Company moved from its facility that it occupied at 200 Murray Hill Parkway, East Rutherford, New Jersey to new office space located at 65 Challenger Road, Ridgefield Park, New Jersey. The Company signed a lease to sub-lease out the space at 200 Murray Hill Parkway to a sub-tenant in June 2015 for the entire premises. The Company recorded a one-time charge in fiscal 2015 of $1,276,477 for exit costs, which included writing off $714,138 of leasehold improvements for the 200 Murray Hill Parkway facility.
In addition to reducing personnel and other expenses, the Company also reduced the number of individual product skus during fiscal 2015, eliminating under performing and unprofitable items. This has led to the Company operating more efficiently and being able to further reduce inventory levels. Inventory at November 30, 2015 was $3,236,802 as compared to $5,181,490 as of November 30, 2014.
The Company had net cash used in operations of $1,727,779 for the year ended November 30, 2015 as compared to net cash used in operations of $5,273,664 for the year ended November 30, 2014. Comprehensive loss was $3,244,211 for fiscal 2015 as compared to a comprehensive loss of $8,981,847 for fiscal 2014. The Company had current assets of $8,880,216 and current liabilities of $11,355,084 at November 30, 2015. Retained earnings decreased to $2,437,192 at November 30, 2015 from $5,681,403 at November 30, 2014. The Company had a line of credit and term loan with Capital Preservation Solutions, LLC which was paid off in full on December 4, 2015 and replaced by a new line of credit with SCM Specialty Finance Opportunities Funds, L.P., an affiliate of CNH Finance, L.P. as of the same date (see Financial Statements Note 18 - Subsequent Events for further information).
Comparison of Operating Results for Fiscal Years 2015 and 2014
For the year ended November 30, 2015, the Company had total revenues of $24,789,555 and net loss from continuing operations of $3,256,632 after a benefit from income taxes of $1,592,309. For the year ended November 30, 2014, the Company had total revenues of $30,578,545, and net loss from continuing operations of $2,803,428, after a benefit from taxes of $1,707,212. Other income decreased to $35,605 for fiscal 2015 as compared to $458,246 for fiscal 2014. The decrease in other income was primarily due to realized gain on sales of investments in fiscal 2014. There was no investment activity in fiscal 2015 as all investments were sold in fiscal 2014. The basic and fully diluted loss per share from continuing operations for fiscal 2015 was $0.46 as compared to a basic and fully diluted loss per share from continuing operations of $0.40 for fiscal 2014.
The Company’s net sales decreased to $24,753,950 for the fiscal year ended November 30, 2015 from $30,120,299 for the fiscal year ended November 30, 2014.
Sales returns and allowances was 11.4% of gross sales for fiscal 2015 and 8.7% for fiscal 2014. Coupon expense, charged against sales allowances, was $117,303 in fiscal 2015 as compared to $463,672 in fiscal 2014. The Company, on an ongoing basis, has returns of products that have been phased out and replaced by new items as part of its marketing plans.
In accordance with accounting principles generally accepted in the United States of America (“GAAP”), the Company reclassified certain advertising and promotional expenditures as a reduction of sales rather than report them as an expense, which had no effect on net income. This reclassification is in accordance with ASC Topic 605-10-S99, “Revenue Recognition” as more fully described in Note 2 (“Sales Incentives”) of the consolidated financial statements for fiscal 2014. The reclassification reflects a reduction in net sales for the fiscal years ended November 30, 2015 and 2014 by $2,243,966 and $2,964,191 respectively.
The Company’s net sales, by category for fiscal 2015 as compared to fiscal 2014 were:
|
| | | | | | | | | | | | | | |
| | Years Ended November 30, |
| | 2015 | | 2014 |
Category | | Net Sales | | | | Net Sales | | |
Skin Care | | $ | 12,845,817 |
| | 51.9 | % | | $ | 13,832,233 |
| | 45.9 | % |
Oral Care | | 8,526,601 |
| | 34.4 | % | | 9,923,216 |
| | 35.3 | % |
Nail Care | | 1,829,461 |
| | 7.4 | % | | 4,159,636 |
| | 13.8 | % |
Fragrance | | 1,034,883 |
| | 4.2 | % | | 1,404,918 |
| | 4.7 | % |
Miscellaneous | | 402,617 |
| | 1.6 | % | | 455,594 |
| | 1.5 | % |
Analgesic | | 114,980 |
| | 0.5 | % | | 310,756 |
| | 1.0 | % |
Hair Care | | (409 | ) | | — | % | | 33,946 |
| | 0.1 | % |
| | $ | 24,753,950 |
| | 100.0 | % | | $ | 30,120,299 |
| | 100.0 | % |
Net sales were affected by the following factors:
| |
• | Net sales of skin care products decreased $986,416 for the twelve months ended November 30, 2015, as compared to the same period in 2014. The decrease in net sales was primarily due to higher returns and allowances for the fiscal year ended November 30, 2015 and lower gross sales. |
| |
• | Net sales of oral care products decreased $1,396,615 for the twelve months ended November 30, 2015 as compared to the same period in fiscal 2014. Gross sales were lower primarily due to decreased volume on two major toothpaste skus. Returns and allowance were comparatively the same when comparing the two periods. |
| |
• | Net sales of nail care products decreased $2,330,175 for the twelve months ended November 30, 2015 as compared to the same period in fiscal 2014. The net sales decreased primarily due to lower gross sales as a result of the Company no longer selling the Health and Wellness line of Nutra Nail products and recording a reserve for returns for the Health and Wellness line. |
| |
• | Net sales of fragrance products decreased $370,035 for the twelve months ended November 30, 2015 as compared to the same period in fiscal 2014. The net sales decreased primarily due to a late shipment of $293,626 for an international order. |
Gross profit margins increased to 57.8% in fiscal 2015 from 54.7% in fiscal 2014. The increase was primarily due to the write off of obsolete inventory in fiscal 2014 and the elimination of unprofitable product items. The total cost of sales as a percentage of gross sales decreased to 35.9% in fiscal 2015 as compared to 37.5% in fiscal 2014.
Selling, general and administrative expenses decreased to $11,574,045 for the year ended November 30, 2015 from $11,794,603 for the 2014 fiscal year. The decrease was as a result of the Company's restructuring plan and continued reduction of expenses, including personnel.
Advertising, cooperative and promotions expenses for fiscal 2015 were $3,524,074 as compared to $6,155,051 for fiscal 2014. The decreased expense of $2,630,977 was comprised of:
| |
• | Decreased media, trade advertising and related expenses of approximately $2,500,000. This decrease is due to decreased spending on the Sudden Change, Bikini Zone, and Plus White brands, along with decreased spending in commercial costs and market research. |
| |
• | There were reset fees of $24,970 in fiscal 2015 as compared to approximately $260,000 that were part of cooperative advertising in fiscal 2014. |
The Company’s advertising expense changes from year to year based on the timing of the Company’s promotions.
Research and development expenses decreased to $75,208 for the 2015 fiscal year from $458,984 for the 2014 fiscal year. The decrease was due to the Company outsourcing regulatory work, as well as utilizing third party contract manufacturers for product development.
The Company had interest expense to a related party of $1,735,967 for the year ended November 30, 2015 as compared to $314,213 for the year ended November 30, 2014. The interest expense - related party consisted of interest expense due to Capital Preservation Solutions LLC for the Company's line of credit and term loan and deferred financing fees. The deferred financing fees were comprised of the value of the warrant that was issued to Capital Preservation Solutions as well as related legal costs (See Financial Statements Note 7 - Debt Agreement for further information regarding the Capital Preservation Solutions LLC loan agreement). The expense was higher in fiscal 2015 as the Company amortized the deferred financing fees over the term of the line of credit and term loan which was fifteen months. The loan closed in September 2014, and therefore three months were amortized in fiscal 2014 and twelve months were amortized in fiscal 2015.
The Company recorded restructuring costs of $2,289,406 for fiscal 2015 and $2,738,570 for fiscal 2014. The restructuring charges consists of severance payments or related accurals to employees in fiscal 2015 and 2014, and facility exit costs in fiscal 2015. The Company had reduced its work force from 37 employees as of November 30, 2014 to 20 as of November 30, 2015. The Company has planned for additional personnel to leave during fiscal 2016, which is included in the accrued restructuring expense as of November 30, 2015. The restructuring plan is expected to be complete by the end of the third quarter of fiscal 2016. Of the restructuring expense of $2,738,570 during fiscal 2014, $1,694,673 was paid in fiscal 2014, $364,515 was paid in 2015, with the balance of $679,382 recorded as an accrued expense on the Company's consolidated balance sheet. The restructuring charge of $2,289,406 during fiscal 2015 consisted of severance payments to employees and facility exit costs. The Company incurred facility exit costs of $1,276,477 as a result of exiting and subsequently sub-letting the Company's prior facility at 200 Murray Hill Parkway, East Rutherford, New Jersey. The exit costs included writing off leasehold improvements of $714,138, real estate commissions paid for the sub-lease of $155,245 and a charge of $407,094 as an estimate for the difference between the rent that the Company pays its East Rutherford landlord per the master lease and the rent received from the sub-tenant over the term of the sub-lease. At the end of fiscal 2015, unpaid restructuring costs of $1,676,781, which are due to be paid in fiscal 2016 and fiscal 2017, was recorded as an accrued expense on the Company's consolidated balance sheet, of which $1,256,781 was recorded as a current accrued liability and $420,000 was recorded as a long term accrued liability.
The loss before benefit from income taxes for continued operations was $4,848,941 for the year ended November 30, 2015, as compared to the loss before benefit from income taxes for continued operations of $4,510,640 for the year ended November 30, 2014.
The effective tax provision for fiscal 2015 was a tax benefit of 32.8% of the net loss before tax as compared to a tax benefit of 37.8% of the net loss before tax for fiscal 2014. This reduction in rate is primarily due to changes in non-deductible expenses as well as adjustments related to the write off of fixed and intangible assets.
The Company discontinued the Gel Perfect nail polish brand and sold the Mega-T dietary supplement brand during fiscal 2014. The result of operations of both brands are recorded on the consolidated statement of operations as discontinued operations. The gain from operations of discontinued brands was $12,421 in fiscal 2015 as compared to a loss of $5,996,041 in fiscal 2014. The loss was higher in fiscal 2014 as both brands were discontinued in fiscal 2014, and there was minimal activity in fiscal 2015.
Comprehensive losses, including continuing and discontinued operations, was $3,244,211 for the year ended November 30, 2015 as compared to comprehensive losses of $8,981,847 for the year ended November 30, 2014. The comprehensive loss for fiscal 2015 reflects the Company’s net loss of $3,256,632 from continuing operations and the net gain of $12,421 from discontinued operations. There were no unrealized gains or losses in fiscal 2015, as the Company sold all of its investments in fiscal 2014.
Comparison of Operating Results for Fiscal Years 2014 and 2013
For the year ended November 30, 2014, the Company had revenues of $30,578,545 and net loss from continuing operations of $2,803,428 and a net loss from discontinued operations of $5,996,041 after a benefit from income taxes of $3,651,431. For the year ended November 30, 2013, the Company had revenues of $28,827,163, and net loss from continuing operations of $3,511,282, and a net loss from discontinued operations of $2,681,966 after a benefit from taxes of $1,550,193. Other income increased to $458,246 for fiscal 2014 as compared to $63,794 for fiscal 2013. The increase was primarily due to realized gain on sales of investments during for fiscal 2014 . The basic and fully diluted loss per share from continuing operations was $0.40 and $0.86 from discontinuing operations for fiscal 2014 as compared to basic and fully diluted loss per share from continuing operations was $0.50 and $0.38 from discontinuing operations for fiscal 2013.
The Company’s net sales increased to $30,120,299 for the fiscal year ended November 30, 2014 from 28,763,369 for the fiscal year ended November 30, 2013.
Sales returns and allowances was 8.75 % of gross sales for fiscal 2014 and 11.7% for fiscal 2013. Coupon expense, charged against sales allowances, was $463,672 in fiscal 2014 as compared to $1,142,894 in fiscal 2013. The Company, on an ongoing basis, has returns of products that have been phased out and replaced by new items as part of its marketing plan.
In accordance with accounting principles generally accepted in the United States of America (“GAAP”), the Company reclassified certain advertising and promotional expenditures as a reduction of sales rather than report them as an expense, which had no effect on net income. This reclassification is in accordance with ASC Topic 605-10-S99, “Revenue Recognition” as more fully described in Note 2 (“Sales Incentives”) of the consolidated financial statements for fiscal 2014. The reclassification reflects a reduction in net sales for the fiscal years ended November 30, 2014 and 2013 by $2,964,191 and $2,527,744 respectively.
The Company’s net sales, by category for fiscal 2014 as compared to fiscal 2013 were:
|
| | | | | | | | | | | | | | |
| | Years Ended November 30, |
| | 2014 | | 2013 |
Category | | Net Sales | | | | Net Sales | | |
Skin Care | | $ | 13,832,233 |
| | 45.9 | % | | $ | 12,901,454 |
| | 44.9 | % |
Oral Care | | 9,923,216 |
| | 32.9 | % | | 10,151,114 |
| | 35.2 | % |
Nail Care | | 4,159,636 |
| | 13.8 | % | | 4,032,870 |
| | 14.0 | % |
Fragrance | | 1,404,918 |
| | 4.7 | % | | 600,886 |
| | 2.1 | % |
Miscellaneous | | 455,594 |
| | 1.5 | % | | 742,395 |
| | 2.6 | % |
Analgesic | | 310,756 |
| | 1.0 | % | | 288,226 |
| | 1.0 | % |
Hair Care | | 33,946 |
| | 0.2 | % | | 46,424 |
| | 0.2 | % |
| | $ | 30,120,299 |
| | 100.0 | % | | $ | 28,763,369 |
| | 100.0 | % |
Net sales were affected by the following factors:
| |
• | Credits for returns and cooperative advertising for the skin care category were substantially lower in fiscal 2014. Cooperative advertising was lower due to negotiating lower advertising allowances with the retailers. |
| |
• | Gross sales of oral care products decreased in fiscal 2014, however the decrease was offset in part by lower returns. The decrease in gross sales was due to lower distribution in fiscal 2014. |
| |
• | Gross sales of nail care products increased in fiscal 2014, primarily due to the launch of the Company's new Nutra Nail Health & Wellness line of products in November 2014. In 2015, the Company will no longer be selling the Health & Wellness line. |
Gross profit margins decreased to 54.7% in fiscal 2014 from 57.1% in fiscal 2013. The decrease was primarily due to the write off of obsolete inventory and the sale of excess inventory at reduced prices that increased the cost of goods sold. Excess inventory was sold in an effort to reduce the amount of inventory that the Company was carrying. The total cost of sales as a percentage of gross sales increased to 37.5% in fiscal 2014 as compared to 31.3% in fiscal 2013.
Selling, general and administrative expenses for fiscal 2014 were $11,794,603 as compared to $18,345,284 for fiscal 2013, a decrease of $6,550,681. The following factors contributed to the decrease:
•Royalty costs decreased $82,951 in fiscal 2014 as compared to fiscal 2013 reflecting the decline in sales.
| |
• | Sales commissions decreased $538,504 due to the Emerson outsourcing. |
| |
• | Shipping costs decreased $1,675,913 in fiscal 2014 as compared to fiscal 2013. The decrease was mainly due to the outsourcing to Emerson of warehouse operations. Emerson utilizes an OHL managed warehouse in Indianapolis, Indiana. |
| |
• | Personnel costs decreased $5,310,009 in fiscal 2014 as compared to fiscal 2013 due to the reduction in work force implemented as a result of the outsourcing plan, as well as decreases in overtime expense. |
| |
• | The decreases in selling, general and administrative expenses were offset by fees and expenses from the Emerson Group of $2,400,174. |
| |
• | Legal and accounting related costs increased $187,848 in fiscal 2014 as compared to fiscal 2013, due to the sale of Mega -T and financing transaction, |
| |
• | Public relations costs decreased $213,211 in fiscal 2014 as compared to fiscal 2013 due to the elimination of the Company's public relations consultant. |
| |
• | Health insurance costs decreased $701,170 in fiscal 2014 as compared to fiscal 2013 due to the reduction in work force. |
| |
• | Travel, meals and entertainment expenses decreased $322,563 in fiscal 2014 as compared to fiscal 2013 as a result of the decrease in personnel, |
| |
• | Consulting and related costs decreased $700,389 in fiscal 2014 as compared to fiscal 2013. The decrease was due to the resignation of David Edell and Ira Berman per their separation agreements (see Item 11, Employment Contracts for further information on the separation agreements). |
| |
• | The balance of the increase or decrease in expenses comprised a number of smaller expense categories. |
Advertising, cooperative and promotions expenses for fiscal 2014 were $6,155,051 as compared to $2,921,199 for fiscal 2013. The increased expense of $3,233,852 was comprised of:
| |
• | An increase in media, trade advertising and related expenses of approximately $2,800,000. This increase is due to increase spending on the Sudden Change, Bikini Zone, and Plus White brands, along with increase spend in commercial costs and market research. |
| |
• | An increase in co-operative advertising of $400,000 to support the Company's brands. |
The Company’s advertising expense changes from year to year based on the timing of the Company’s promotions.
The Company recorded restructuring costs of $2,738,570 for the year ended November 30, 2014. On January 20, 2014, the Company announced that its Board of Directors has approved management’s plan to restructure the Company’s operations, and enter into a key business partnership with The Emerson Group, a premier sales and marketing company located in Wayne, Pennsylvania. As part of this change, the Company has outsourced to Emerson certain sales and administrative functions effective February 1, 2014. In addition, warehousing and shipping was outsourced to Ozburn-Hessey Logistics "OHL", one of the largest integrated global supply chain management companies in the United States. The Company’s inventory was moved to an OHL-managed facility in Indianapolis, Indiana and shipping commenced from there as of the week of February 3, 2014. A key benefit of the outsourcing move is that it shifted a substantial portion of the Company’s current fixed costs into a variable cost structure moving forward which can ultimately help keep expenses in better alignment with any future revenue generated by its brands. As part of the outsourcing plan, the Company reduced its work force from 98 to 37 employees during fiscal 2014, which resulted in a $5,177,287 annualized reduction in personnel costs. The Company has planned for additional personnel to leave will continue through 2016. The restructuring plan should be complete by the end of the third
quarter of fiscal 2016. The restructuring charge of $2,738,570 during fiscal 2014 consisted of severance payments to employees. Of this amount, $1,694,673 was paid in fiscal 2014, with the unpaid amount of $1,043,897 recorded as an accrued expense on the Company's consolidated balance sheet.
The loss before benefit from income taxes for continued operations was $4,510,640 for the year ended November 30, 2014, as compared the loss before benefit from income taxes for continued operations of $5,540,823 for the year ended November 30, 2013.
The effective tax provision for fiscal 2014 was a tax benefit of 37.8% of the net loss before tax as compared to a tax benefit of 36.6% of the net loss before tax for fiscal 2013. The increase in the tax benefit was due to lower non-deductible expenses and adjustments, offset by a lower state income tax rate.
The Company discontinued the Gel Perfect nail polish brand and sold the Mega-T dietary supplement brand during fiscal 2014. The result of operations of both brands are recorded on the consolidated statement of operations as discontinued operations. The loss from operations of discontinued brands was $5,996,041 in fiscal 2014 as compared to a loss of $2,681,966 in fiscal 2013. The loss was higher in fiscal 2014 due to higher returns of the discontinued product, increased reserves for the Company's estimate of future returns and inventory write-offs.
Comprehensive losses, including continuing and discontinued operations, was $8,981,847 for the year ended November 30, 2014 as compared to comprehensive losses of $6,046,117 for the year ended November 30, 2013. The comprehensive loss for fiscal 2014 reflects the Company’s net loss of $2,803,428 from continuing operations, the net loss of $5,996,041 from discontinued operations, unrealized holding gains arising during fiscal 2014, net of tax of $36,888 and a reclassification adjustment for gains included in net income, net of income tax, of $219,266.
Superstorm Sandy
As a result of Super Storm Sandy, the Company made claims for loss against various insurance policies. In the case of one claim for $340,689, the Company did not determine the claim was realizable until May 2013 and received proceeds of $340,689 in June 2013. The Company recorded the proceeds as a reduction of selling, general and administrative expenses on the Consolidated Statements of Operations for the fiscal year ended 2013.
Financial Position as of November 30, 2015
As of November 30, 2015, the Company had working capital of $(2,474,868) as compared to $900,826 at November 30, 2014. The ratio of total current assets to current liabilities is 0.8 to 1 as of November 30, 2015, as compared to a ratio of 1.1 to 1 for the prior year. Working capital and the current ratio decreased due to the Company's line of credit and term loan balances being classified as a current liability as of November 30, 2015. They were classified as a long term liability on the balance sheet as of November 30, 2014. The Company’s cash position at November 30, 2015 was $509,884, versus cash of $241,621 as at November 30, 2014. The Company had no investments at at November 30, 2015. As of November 30, 2015, there were no dividends declared.
Accounts receivable as of November 30, 2015 and 2014 were $2,112,055 and $2,248,301 respectively. Included in net accounts receivable are an allowance for doubtful accounts, a reserve for returns and allowances and a reduction based on an estimate of co-operative advertising that will be taken as credit against payments. The allowance for doubtful accounts was $4,911 and $25,124 for November 30, 2015 and 2014, respectively. The reserve for returns and allowances is a combination of specific and general reserve amounts relating to accounts receivable. The general reserve is calculated based on historical percentages applied to aged accounts receivable and the specific reserve is established and revised based on individual customer circumstances.
The reserve for returns and allowances is based on the historical returns as a percentage of sales in the five preceding months, adjusting for returns that can be put back into inventory, and a specific reserve based on customer circumstances. This allowance decreased to $1,315,769 as of November 30, 2015 from $3,596,399 as of November 30, 2014. Of this amount, allowances and reserves in the amount of $407,992, which are anticipated to be deducted
from future invoices, are included in accrued liabilities. The reserve for returns and allowances was higher as of November 30, 2014 due to higher specific reserves of $1,132,000 for Gel Perfect and $454,000 based on notification from a retailer of their intent to return product in fiscal 2014.
Gross receivables were further reduced by $424,373 as of November 30, 2015, which was reclassified from accrued liabilities, as an estimate of the co-operative advertising that will be taken as a credit against payments. In addition, accrued liabilities include $1,697,493, which is an estimate of co-operative advertising expense relating to fiscal 2015 sales which are anticipated to be deducted from future invoices rather than current accounts receivable.
Inventories were $3,236,802 and $5,181,490, as of November 30, 2015 and 2014, respectively. The decline in inventory is due to lower sales, the Company no longer marketing the Health and Wellness brand and the elimination of unprofitable product items. The reserve for inventory obsolescence is based on a detailed analysis of inventory movement. The inventory obsolescence reserve decreased to $821,259 as of November 30, 2015 from $992,296 as of November 30, 2014. Changes to the inventory obsolescence reserves are recorded as an increase or decrease to the cost of sales.
Prepaid expenses and sundry receivables increased to $697,097 as of November 30, 2015 from $631,204 as of November 30, 2014. The increase was in the ordinary course of business.
Prepaid and refundable income taxes decreased to $70,056 as of November 30, 2015, from $453,598 as of November 30, 2014 primarily due to the collection of tax refunds in fiscal 2015.
The amount of deferred income tax reflected as a current asset decreased to $2,254,322 as of November 30, 2015 from $2,883,285 as of November 30, 2014. The $628,963 decrease was due to the allocation of the deferred tax between current and long term assets.
The Company’s investment in property and equipment consisted mostly of leasehold improvements, office furniture and equipment, and computer hardware and software to accommodate our personnel in addition to tools and dies used in the manufacturing process. The Company acquired $113,495 of additional property and equipment during fiscal 2015. The Company, also, wrote off $714,138 of leasehold improvements pertaining to the East Rutherford facility in the second quarter of fiscal 2015. In addition, the Company wrote off $146,831 of furnishings and equipment that were not needed in the new facility.
The Company had intangible assets of $434,166 as of November 30, 2015 as compared to $654,840 as of November 30, 2014. During the fiscal year ended November 30, 2015, the Company wrote off $220,286 as part of its annual impairment evaluation of patents and trademarks that were no longer in use with no plans for future use.
The Company had deferred financing fees of $0 as of November 30, 2015 and $1,341,458 as of November 30, 2014. On September 5, 2014, the Company entered into a Loan and Security Agreement (the “Agreement”) with Capital Preservation Solutions, LLC (“Capital”) for a $5,000,000 working capital line of credit and a term loan for working capital purposes not to exceed $1,000,000. Capital Preservation Solutions, LLC is owned by Lance Funston, the Company's Chairman of the Board and Chief Executive Officer, who also is the managing partner of Capital Preservations Holdings, LLC and which owns all of the Company's Class A common stock. Contemporaneously with the signing of the Agreement, the Company issued a Warrant to Purchase Common Stock (the “Warrant”) to Capital whereby Capital may acquire upon exercise of the Warrant, 1,892,744 shares of the Company’s Common Stock. The Warrant may be exercised in whole or in part at any time during the exercise period which is five years from the date of the Warrant. The Warrant bears a purchase price of $3.17 per share, subject to adjustments. The working capital line of credit and term loan were recorded on the consolidated balance sheet as of November 30, 2015 and 2014 as from a related party. The deferred financing fees are comprised of the value of the warrant that was issued to Capital Preservation Solutions as well as related legal costs.
The Company had non-current deferred tax assets of $9,200,599 as of November 30, 2015 as compared to $6,988,195 as of November 30, 2014. The increase was due to a reallocation of the deferred tax asset from a current asset to a non-current asset as well as the net loss incurred in fiscal 2015.
Current liabilities were $11,355,084 and $10,738,673, as of November 30, 2015 and 2014, respectively. Current liabilities at November 30, 2015 consisted of accounts payable, accrued liabilities and short-term capital lease obligations. As of November 30, 2015, there was $2,121,866 of open cooperative advertising commitments, of which $598,335 is from 2015, $934,232 is from 2014, and $589,299 is from 2013. Of the total amount of $2,121,866, $424,373 is reflected as a reduction of gross accounts receivables, and $1,697,493 is recorded as an accrued expense. Cooperative advertising is advertising that is run by the retailers in which the Company shares in part of the cost. If it becomes apparent that this cooperative advertising was not utilized, the unclaimed cooperative advertising will be offset against the expense during the fiscal year in which it is determined that it did not run. This procedure is consistent with the prior year’s methodology with regard to the accrual of unsupported cooperative advertising commitments.
Accrued liabilities included restructuring charges incurred, but not yet paid of $1,676,781. The restructuring charges are unpaid severance obligations as a result of the Company's reduction in work force during fiscal 2014 and 2015. The severance charges are expected to be fully paid by the end of January 2017. Also included in accrued liabilities are payments due to David Edell of $238,807 and Ira Berman of $232,021 as per their respective separation agreements. On September 5, 2014, the Company entered into Separation Agreements with its two founding shareholders, David Edell and Ira Berman, (the “Founders”) whereby they are no longer required to perform any consulting services pursuant to their Amended and Restated Employment Agreements. The Company made a payment of $1,000,000 to the Founders on the separation date and is required per the Separation Agreements, as amended, to make an additional payment of $200,000 to the Founders on October 1, 2015 and pay $794,620 in monthly installments commencing on October 3, 2014. The final monthly installment is expected to be paid in July 2016.
Long-Term Obligations, Credit Agreement and Issuance of Warrant
The Company’s long-term obligations as of November 30, 2015 were for a portion of its capitalized leases and a security deposit for the sub-lease of its former facility in East Rutherford, New Jersey. The long-term obligations as of November 30, 2014 were for a working capital line of credit, a term loan and a portion of its capitalized leases, which is for certain office and warehouse equipment. The Company reclassified the working capital line of credit and term as a current liability on the consolidated balance sheet as of November 30, 2015. On September 5, 2014, the Company entered into a Loan and Security Agreement (the “Agreement”) with Capital Preservation Solutions, LLC (“Capital”) for a $5,000,000 working capital line of credit and a term loan for working capital purposes not to exceed $1,000,000. The line of credit and term loan have an interest rate of 6% and mature on December 5, 2015. The advances made under these loan agreements are subject to a borrowing base calculation that includes 80% of the eligible accounts receivable plus 50% of the value of the eligible inventory. All amounts outstanding under these agreements are secured by a first priority security interest in all of the assets of the Company. Capital is owned by Lance Funston, the Company's Chairman of the Board and Chief Executive Officer, who is also the managing partner of Capital Preservation Holdings, LLC, which owns all of the Class A common stock. Accordingly, the line of credit and term loan are shown on the consolidated balance sheet as from a related party. The line of credit and term loan were paid-off by the Company on December 4, 2015 (see Financial Statements Note 18 - Subsequent Events for further information).
Contemporaneously with the signing of the Agreement, the Company issued a Warrant to Purchase Common Stock (the “Warrant”) to Capital whereby Capital may acquire upon exercise of the Warrant 1,892,744 shares of the Company’s Common Stock. The Warrant may be exercised in whole or in part at any time during the exercise period which is five years from the date of the Warrant. The Warrant bears a purchase price of $3.17 per share, subject to adjustments. The value of the Agreement was allocated to the relative fair values of the Loan and Security Agreement and Warrant, resulting in an allocation of value to the Warrant of $1,456,400, which was recorded on the financial statements as additional paid-in capital as of September 5, 2014, with an asset of $1,213,667 recorded as deferred financing fees and a reduction of Term Loan- Related Party of $242,733 recorded as debt discount. The deferred financing fees were fully amortized as of November 30, 2015.
Shareholder's Equity and Cash Flow
Shareholders’ equity decreased to $6,389,141 as of November 30, 2015 from $9,565,954 as of November 30, 2014. The decrease was due to decreases in retained earnings of $3,244,211 as a result of the net loss from continuing and discontinued operations.
The Company's cash used in operating activities was $1,727,779 during fiscal 2015, as compared to $5,273,664 that was used by operating activities during fiscal 2014. The use of cash in fiscal 2015 was mainly due to the net loss from continuing and discontinued operations of $3,244,211, offset by non-cash transactions that in the aggregate were $1,223,371 and aggregated changes in operating asset and liability accounts of $293,061. Net cash used in investing activities was $99,895 in fiscal 2015, as a result of leasehold improvements to the Company's new facility in Ridgefield Park, New Jersey, acquisition of equipment and proceeds from the sale of equipment no longer needed. Cash flow provided by financing activities was $2,095,937 during the year ended November 30, 2015, as a result of increased borrowing under the Company's line of credit with Capital Preservation Solutions, LLC. The Company’s cash balance increased by $268,263 during fiscal 2015.
Liquidity and Capital Resources
Liquidity is defined as the ability to generate adequate amounts of cash to meet short-term and long-term business needs. We assess our liquidity in terms of our total cash flow and the amounts of cash and credit availability. Significant factors that could affect our liquidity include the following:
| |
• | Cash flow generated or used by operating activities; |
| |
• | Restructuring liabilities due to be paid in fiscal 2016; |
| |
• | The ability and success of the Company being able to complete its restructuring plan; |
| |
• | Completion of the move to turn-key manufacturing of the Company's products; |
| |
• | Availability of sufficient funding under the Company's line of credit; |
Our primary capital needs in fiscal 2016 are working capital requirements, payments of accrued employee severance costs, amounts due to David Edell and Ira Berman pursuant to their respective Separation Agreements (See Item 13 - Certain Relationships, and Related Transactions, and Director Independence for further information on the Separation Agreements) and payments for accrued media invoices incurred in fiscal 2015. The Company anticipates that a substantial amount of the cash provided by operations will be used to pay the accrued severance costs, Separation Agreement payments and accrued media invoices, and accordingly does not anticipate a material improvement in working capital until fiscal 2017. On December 4, 2015 (the “Closing Date”), CCA Industries, Inc., a Delaware corporation (the “Company”), entered into the Credit and Security Agreement (the “Credit Agreement”) with SCM Specialty Finance Opportunities Funds, L.P., an affiliate of CNH Finance, L.P. (together "SCM"). The Credit Agreement provides for a line of credit up to a maximum of $5,500,000 (the “Revolving Loan”). The proceeds of the Revolving Loans are to be used to pay off the Company's existing debt with Capital Preservation Solutions, LLC and for general working capital purposes.
Pursuant to the Credit Agreement, all outstanding amounts under the Revolving Loan bear interest at the 30 day LIBOR rate plus 6% per annum (currently in the aggregate, 6.21% per annum), payable monthly in arrears. The Company is also required to pay a monthly unused line fee and collateral management fee. The commitment under the Credit Agreement expires three years after the Closing Date. The Revolving Loan and all other amounts due and owing under the Credit Agreement and related documents are secured by a first priority perfected security interest in, and lien on, substantially all of the assets of the Company. Amounts available for borrowing under the Line of Credit equal the lesser of the Borrowing Base (as defined below), and $5,500,000, in each case, as the same is reduced by the aggregate principal amount outstanding under the Line of Credit. “Borrowing Base” under the Loan Agreement means, generally, the amount equal to (i) 85% of the Company’s eligible accounts receivable, plus (ii) 65% of the value of eligible inventory, less (iii) certain reserves. The Credit Agreement contains customary representations, warranties and covenants on the part of the Company, including a financial covenant requiring the Company to maintain a fixed charge coverage ratio of no less than 1.0 to 1.0. The Credit Agreement imposes an early termination fee and also provides for events of default, including failure to repay principal and interest when due and failure to perform or violation of the provisions or covenants of the agreement.
On the Closing Date, the Company drew $4,100,000 on the Revolving Loan. Of the amount drawn, $3,721,583 was used to pay the principal amount of $3,700,000 and accrued interest of $21,583 due under the Company's Loan
Agreement with Capital Preservation Solutions, LLC entered into on September 4, 2015. Capital Preservation Solutions is controlled by Lance T. Funston, the Chairman of the Board of the Company and Chief Executive Officer. The balance of the funds drawn were used to pay certain fees and expenses related to entering into the Credit Agreement, with a balance of $46,032 remitted to the Company.
The Company believes that it will have sufficient capital resources to meet its working capital requirements for the next twelve months. This expectation depends upon SCM providing the Company with funds under the line of credit as required and the Company’s ability to borrow additional funds under the line of credit subject to the borrowing base; our future operating performance including the absence of any unforeseen cash requirements; and the achievement of anticipated cost savings in connection with our outsourcing agreements.
Based on our assumptions concerning capital resources and liquidity, which include achieving our internal forecast and operating plan for improved net sales, operating results and operating cash flows, anticipated credit from vendors and achieving the expected benefits from our outsourcing and restructuring plans, we anticipate that the Company will have sufficient internal and external sources of liquidity to fund operations and anticipated working capital and expected cash needs for the next twelve months. This expectation depends upon our future operating performance, the achievement of our operating plan and internal forecast, absence of unforeseen cash requirements, continuation of our credit facility availability, continued support of vendors at existing levels and the absence of any significant deterioration in economic conditions.
Our operating plan for fiscal 2016, while forecasting lower net sales as compared to fiscal 2015, also anticipates improved operating results and cash flows from operations as a result of lower expenses as we progress with the implementation of our restructuring plans and other initiatives. Our ability to achieve our operating plan is based on a number of assumptions which involves significant judgment, risk, and estimates of future performance which we cannot assure. As a result, we cannot assure that cash flows and other sources of liquidity will at all times be sufficient for our cash requirements. We will continue to monitor our performance and liquidity and if we believe operating results will be below our expectations or we determine at any time that it is appropriate or necessary to obtain additional liquidity, we will take further steps seeking to improve our financial position, such as modifying our operating plan, seeking to further reduce costs and adjust cash spend, and evaluating other alternatives and opportunities to obtain additional sources of liquidity. We cannot assure that any of these actions would be sufficient or available, or if available, available on favorable terms.
Critical Accounting Estimates
Our consolidated financial statements include the use of estimates, which management believes are reasonable. The process of preparing financial statements in conformity with accounting principles generally accepted in the United States (“GAAP”) requires management to make estimates and assumptions regarding certain types of assets, liabilities, revenues, and expenses. Such estimates primarily relate to unsettled transactions and events as of the date of the financial statements. Accounting estimates and assumptions are those management considers to be most critical to the financial statements because they inherently involve significant judgment and uncertainties. All of these estimates and assumptions reflect management’s best judgment about current economic and market conditions and their effects on the information available as of the date of the consolidated financial statements. Accordingly, upon settlement, actual results may differ from estimated amounts.
An accounting estimate is deemed to be critical if it is reasonably possible that a subsequent correction could have a material effect on future operating results or financial condition. The following are estimates that management has deemed to be critical:
1 - Reserve for Returns—The allowances and reserves which are anticipated to be deducted from gross accounts receivables are recorded as a reserve for returns, which reduces the net accounts receivable. The allowances and reserves which are anticipated to be deducted from future invoices are included in accrued liabilities. The estimated reserve is based in part on historical returns as a percentage of gross sales. The current estimated return rate is 5.31% of gross sales. Management estimates that any returns of product received from customers are not placed back into inventory, and subsequently destroyed. Any changes in this accrued liability are recorded as a debit or credit to the
reserve for returns and allowances account. The Company may increase the reserve for returns in excess of the current estimated return rate for specific return circumstances.
2 - Allowance for Doubtful Accounts – The allowance for doubtful accounts is an estimate of the loss that could be incurred if our customers do not make required payments. Trade receivables are periodically evaluated by management for collectability based on past credit history with customers and their current financial condition. Changes in the estimated collectability of trade receivables are recorded in the results of operations for the period in which the estimate is revised. Estimates are made based on specific disputes and additional reserves for bad debt based on the accounts receivable aging ranging from 0.35% for invoices currently due to 2.00% for invoices more than ninety-one days overdue. Trade receivables that are deemed uncollectible are offset against the allowance for uncollectible accounts. The Company generally does not require collateral for trade receivables.
3 - Inventory Obsolescence Reserve – Management reviews the inventory records on a monthly basis. Management deems to be obsolete finished good items that are no longer being sold, and have no possibility of sale within the ensuing twelve months. Components and raw materials are deemed to be obsolete if management has no planned usage of those items within the ensuing twelve months. In addition, management conducts periodic testing of inventory to make sure that the value reflects the lower of cost or market. If the value is below market, a provision is made within the inventory obsolescence reserve. This reserve is adjusted monthly, with changes recorded as part of cost of sales in the results of operations.
4 - The deferred taxes are an estimate of the future tax consequences attributable to the temporary differences between the carrying amounts of assets and liabilities as recorded on the Company’s financial statements and the carrying amounts as reflected on the Company’s income tax return. In addition, the portion of charitable contributions that cannot be deducted in the current period and are carried forward to future periods are also reflected in the deferred tax assets. A substantial portion of the deferred tax asset is due to the loss incurred in fiscal 2015 and prior years, the benefit of which will be carried forward into future tax years. Deferred tax assets and liabilities are valued using the tax rates expected to apply in the years in which those temporary differences are expected to be recovered or settled. Deferred tax assets are reduced by a valuation allowance when, in the opinion of management, it is more likely than not that some portion, or all of the deferred tax asset will not be realized. Management has estimated that it will utilize the entire deferred tax asset in future years based on its belief that the Company will be profitable. Management expects future profitability based on the outsourcing of many functions to The Emerson Group, a substantial reduction in personnel and a reduction in other expenses. However profits can be impacted in the future if the Company’s sales decrease. The portion that management expects to utilize in fiscal 2016 is recorded as a short term asset, and the portion that management expects to utilize in fiscal years subsequent to fiscal 2016 are recorded as a long term asset.
5 - Co-operative advertising Reserve – The Co-operative advertising reserve is an estimate of the amount of the liability for the co-operative advertising agreements with the Company’s customers. A portion of the reserve that is estimated to be deducted from future payments is a direct reduction of accounts receivable. The portion that the Company estimates to be deducted from future invoices rather than current accounts receivable is recorded as an accrued expense. Management reviews the co-operative advertising agreements for the current fiscal year with its customers on a monthly basis and adjusts this reserve based on actual co-operative advertising events. The Company maintains an open liability for co-operative advertising contracts for which a customer has not claimed a deduction for the three years prior to the current fiscal year. Management evaluates the open liability for the prior three years on a monthly basis to determine if the liability continues to exist. Changes to the reserve are charged as a current period expense.
Inventory, Seasonality, Inflation and General Economic Factors
The Company attempts to keep its inventory for its product at levels that will enable shipment against orders to be fulfilled on a timely basis. However, certain components must be inventoried well in advance of actual orders because of time-to-acquire circumstances. For the most part, purchases are based upon anticipated quarterly requirements, which are projected based upon sales indications, and general business factors. All of the Company’s contract manufactured products and components are purchased from non-affiliated entities. Warehousing and shipping was provided at Company facilities until February 2014. Effective February 2014, the Company outsourced shipping and warehousing through Emerson to an OHL managed facility, located in Indianapolis, Indiana.
Sales of many of the Company’s products are not particularly seasonal, but sales of its sun-care and depilatory products usually peak during the spring and summer seasons. The Company does not have a product that can be identified as a ‘Christmas item’ and typically does not experience any sales peak during the holiday season.
The Company plans to continue to promote its sales through an advertising program consisting of a combination of media and co-op advertising. We are trying to decrease the amount of “on hand” inventory we stock; however to better service our customers we often find it difficult to reduce our “safety stock”.
Because our products are sold to retail stores (throughout the United States and abroad), sales are particularly affected by general economic conditions. Accordingly, any adverse change in the economic climate in the U.S. or abroad can have an adverse impact on the Company’s sales and financial condition. The Company does not believe that inflation or other general economic circumstances that would further negatively affect operations can be predicted at present, but if such circumstances should occur, they could have material and negative impact on the Company’s net sales and revenues, unless the Company was able to pass along related cost increases to its customers.
Contractual Obligations
The following table sets forth the contractual obligations as of November 30, 2015. Such obligations include the Company's debt, current lease for the Company’s premises, written employment contracts and License Agreements, less sub-lease rental income.
|
| | | | | | | | |
| Less than | | | More than |
| 1 Year | 1-3 Years | 3-5 Years | 5 years |
Leases on Premises (1) | $864,072 | $1,738,338 | $1,721,658 | $1,064,421 |
Royalty Expense (2) | 250,000 |
| 500,000 |
| 500,000 |
| 250,000 |
|
Employment Contracts (3) | 1,755,786 |
| 980,000 |
| 560,000 |
| 280,000 |
|
Other Contractual Obligations (4) | 906,041 |
| 500,000 |
| | |
Other Operating Leases | 42,909 |
| 2,400 |
| — |
| — |
|
Capital Lease Obligations | 4,295 |
| 4,295 |
| — |
| — |
|
Open Purchase Orders (5) | 2,802,027 |
| — |
| — |
| — |
|
Total Contractual Obligations | $6,625,130 | $3,725,033 | $2,781,658 | $1,594,421 |
Sub-lease rental income (6) | $653,562 | $1,334,160 | $1,371,420 | $1,052,878 |
Net Contractual Obligations | $5,971,568 | $2,390,873 | $1,410,238 | $541,543 |
| |
(1) | The leases consist of a lease for the Company's office located in Ridgefield Park, New Jersey and a lease for the Company's former facility located in East Rutherford, New Jersey. The Ridgefield Park lease is a net lease requiring a yearly rental of $154,458, with annual increases over the term of the lease. Included in the annual rental cost is a charge of $1.75 per square foot per year for electric costs. The lease is for five years and four months, commencing April 10, 2015, and contains a provision for four months of rent at no charge. The East Rutherford lease is a net lease requiring a yearly rental of $503,676 plus Common Area Maintenance “CAM”, which is estimated at $205,938 per year and includes real estate taxes, common area expense, utility expense, repair and maintenance expense and insurance expense. See Part I, Item 2 for further information. The rental provided above is the base rental and estimated CAM. The lease has an annual CPI adjustment, not to cumulatively exceed 30% in any consecutive five year period. The Company signed a new lease for the premises beginning June 1, 2012 and expiring May 31, 2022, with a renewal option at fair market value for an additional five years. CAM has been estimated at $205,938 per year for future years beginning in fiscal 2017. |
| |
(2) | See Part I, Item 1(f). The Company is not required to pay any royalty in excess of realized sales if the Company chooses not to continue under the license. The figures set forth above reflect estimates of the anticipated minimum royalty expense required to maintain the licenses under the Alleghany Pharmacal license agreement. The more than 5 years column only reflects one year of minimum payments for Alleghany Pharmacal; the payments can continue in perpetuity in order to maintain the license. |
| |
(3) | On March 21, 2011, the compensation committee of the board of directors, acting on behalf of the Company, entered into an Employment Agreement (each, an “Employment Agreement”) with Stephen A. Heit, and Drew Edell (each, an “Executive”). Pursuant to their respective Employment Agreements Mr. Heit was engaged to continue to serve as the Company’s Executive Vice President and Chief Financial Officer, and Mr. Edell was engaged to continue to serve as the Company’s Executive Vice President, Product Development and Production. Except as set forth below, the Employment Agreements contain substantially similar terms to each other. The initial term of employment under each of the Employment Agreements ran from March 21, 2011 through December 31, 2013, with successive one-year renewal terms thereafter unless the Company or the Executive chooses not to renew the respective Employment Agreement. Under the respective Employment Agreements, the base salaries of Mr. Heit, and Mr. Edell were established as $250,000, and $275,000 per annum, respectively, subject to annual increases at the discretion of the Company’s Board of Directors. Mr. Heit's base salary was increased to $280,000, effective October 1, 2014. The Executives are eligible to receive an annual performance-based bonus under their respective Employment Agreement, and are entitled to participate in Company equity compensation plans. In addition, each of the Executives receives an automobile allowance, health insurance and certain other benefits. In the event of termination of the respective Employment Agreement as a result of the disability or death of the Executive, the Executive (or his estate or beneficiaries) shall be entitled to receive all base salary and other benefits earned and accrued until such termination as well as a single-sum payment equal to the Executive’s base salary and a single-sum payment equal to the value of the highest bonus earned by the Executive in the one-year period preceding the date of termination pro-rated for the number of days served in that fiscal year. If the Company terminates the Executive for Cause (as defined in the respective Employment Agreement), or the Executive terminates his employment in a manner not considered to be for Good Reason, the Executive shall be entitled to receive all base salary and other benefits earned and accrued prior to the date of termination. If the Company terminates the Executive in a manner that is not for Cause or due to the Executive’s death or disability, the Executive terminates his employment for Good Reason, or the Company does not renew the Employment Agreement after December 31, 2013, the Executive shall be entitled to receive a single-sum payment equal to his unpaid base salary and other benefits earned and accrued prior to the date of termination and a single-sum payment of an amount equal to three times the average of the base salary amounts paid to Executive over the three calendar years prior to the date of termination. In addition, each Executive is entitled to certain benefits in connection with a Change of Control (as defined in their respective Employment Agreements). Under the Employment Agreements, each Executive agreed to non-competition restrictions for a period of six months following the end of the term of his Employment Agreement, during which period the Executive will be paid an amount equal to his base salary for a period of six months, and an amount equal to the pro rata share of any bonus attributable to the portion of the year completed prior to the date of termination. The Executives also agreed to confidentiality and non-solicitation restrictions under the Employment Agreements. The foregoing summary of the Employment Agreements is qualified in their entirety by the full text of the Employment Agreements, copies of which may be found in Form 8-K that was filed by Company on March 21, 2011 with the United States Securities and Exchange Commission. The Company also entered into an Employment Agreement with another Company executive, who is not a “named executive officer” within the meaning of the Securities Exchange Act of 1934, as amended and related regulations. This additional Employment Agreement contains substantially similar terms as the Employment Agreements discussed above and provides for a base salary which is currently $140,000 per annum. The Company elected to continue Mr. Stephen A. Heit's contract for 2016. The Company chose to terminate the employment of Drew Edell, effective November 30, 2014. See Item 11 below for information regarding Mr. Edell’s severance payments in connection with termination. The Employment Contract committment in the less than one year column also include payments to be made to David Edell and Ira Berman pursuant to their respective Separation Agreements (See Item 13 - Certain Relationships and Related Transactions for further information). The more than 5 years column only reflects one year of employment contract payments for Stephen Heit; the payments can continue in perpetuity so long as the Company does not terminate the Employment Agreement. |
| |
(4) | Other Contractual Obligations consist of accrued media invoices for advertising that ran in fiscal 2015. The Company has payment plans for its media vendors. |
| |
(5) | Open purchase orders reflect purchase orders issued as of November 30, 2015. |
| |
(6) | Sub-lease rental income is for the sub-lease of the Company's former facility at 200 Murray Hill Parkway, East Rutherford, New Jersey. See Item 2 - Properties for further information regarding the sub-lease. |
Recent Accounting Pronouncements
In February 2016, the Financial Accounting Standards Board ("FASB") issued Accounting Standards Update No. 2016-02, Leases. The new standard establishes a right-of-use (ROU) model that requires a lessee to record a ROU asset and a lease liability on the balance sheet for all leases with terms longer than 12 months. Leases will be classified as either finance or operating, with classification affecting the pattern of expense recognition in the income statement. The new standard is effective for fiscal years beginning after December 15, 2018, including interim periods within those fiscal years. A modified retrospective transition approach is required for lessees for capital and operating leases existing at, or entered into after, the beginning of the earliest comparative period presented in the financial statements, with certain practical expedients available. While we are still evaluating the impact of our pending adoption of the new standard on our consolidated financial statements, we expect that upon adoption we will recognize ROU assets and lease liabilities and that the amounts could be material.
In November 2015, the FASB issued ASU 2015-17, which is an update to Topic 740, "Income Taxes". The update will require that all deferred tax assets and liabilities be classified as non-current. The update is effective for fiscal years, and the interim periods within those years, beginning after December 15, 2016. ASU 2015-17 will have a material impact on the Company's balance sheet, as the deferred tax reported as a current asset will be reported as a non-current asset once the update is effective, resulting in a decrease to the Company's current ratio. As of November 30, 2015, the Company reported $2,254,322 of deferred tax as a current asset. It is not expected to have a material impact on the Company's results of operations.
In August 2015, the FASB issued ASU 2015-14, which is an update to Topic 606, "Revenue from Contracts with Customers". In May 2014, Financial Accounting Standards Board (“FASB”) issued Accounting Standards Update ("ASU") 2014-09, "Revenue from Contracts with Customers". ASU 2014-09 is a comprehensive new revenue recognition model that requires a company to recognize revenue to depict the transfer of good or services to a customer at an amount that reflects the consideration it expects to receive in exchange for those goods or services. ASU 2015-14 changes the effective date to annual reporting periods beginning after December 15, 2017, and including interim period within that period. Early adoption is permitted for annual reporting periods beginning after December 15, 2016 and including interim reporting periods within that period. Companies may use either a full retrospective or modified retrospective approach to adopt this ASU and our management is currently evaluating which transition approach to use. We are currently evaluating the impact of adopting ASU 2015-14 on our consolidated financial statements and related disclosures.
Management does not believe that any recently issued, but not yet effective, accounting standards if currently adopted would have a material effect on the accompanying financial statements.
Item 7A. QUANTITATIVE AND QUALITATIVE DISCLOSURE ABOUT MARKET RISK
The Company did not have any investments or marketable securities as of November 30, 2015.
Item 8. FINANCIAL STATEMENTS AND SUPPLEMENTARY DATA
The Financial Statements are listed under Item 15 in this Form 10-K. The following financial data is a summary of the quarterly results of operations (unaudited) during and for the years ended November 30, 2015 and 2014:
|
| | | | | | | | | | | | | | | | | |
| | | | Three Months Ended | | | |
Fiscal 2015 | | Feb. 28 | | May 31 | | Aug. 31 | | Nov 30 | |
Net Sales | | 6,952,857 |
| | 6,666,621 |
| | 7,055,399 |
| | 4,079,073 |
| |
Total Revenue | | 6,957,516 |
| | 6,670,233 |
| | 7,079,673 |
| | 4,082,133 |
| |
Cost of Sales | | 2,318,485 |
| | 2,920,313 |
| | 2,704,117 |
| | 2,502,454 |
| |
Gross Profit | | 4,634,372 |
| | 3,746,308 |
| | 4,351,282 |
| | 1,576,619 |
| |
Income (Loss) from Continued Operations | | 57,608 |
| | (1,776,992 | ) | | 175,080 |
| | (1,712,328 | ) | |
(Loss) Income from Discontinued Operations | | — |
| | 190,274 |
| | (125,191 | ) | | (52,662 | ) | |
Net (Loss) Income | | $ | 57,608 |
| | $ | (1,586,718 | ) | | $ | 49,889 |
| | $ | (1,764,990 | ) | |
Earnings (Loss) Per Share: | | | | | | | | | |
Basic | | | | | | | | | |
Continuing Operations | | $ | 0.01 |
| | $ | (0.25 | ) | | $ | 0.02 |
| | $ | (0.24 | ) | |
Discontinued Operations | | $ | — |
| | $ | 0.03 |
| | $ | (0.02 | ) | | $ | (0.01 | ) | |
Total (loss) earnings per share | | $ | 0.01 |
| | $ | (0.22 | ) | | $ | — |
| | $ | (0.25 | ) | |
Diluted | | | | | | | | | |
Continuing Operations | | $ | 0.01 |
| | $ | (0.25 | ) | | $ | 0.02 |
| | $ | (0.24 | ) | |
Discontinued Operations | | $ | — |
| | $ | 0.03 |
| | $ | (0.02 | ) | | $ | (0.01 | ) | |
Total (loss) earnings per share | | $ | 0.01 |
| | $ | (0.22 | ) | | $ | — |
| | $ | (0.25 | ) | * |
* - Certain charges relating to the continued restructuring of the Company's business should have been recognized in the second quarter of 2015. The Company subsequently corrected this error and recorded these charges during the forth quarter of 2015. The impact of this item would have increased net loss by $420,000 in the second quarter of 2015 and correspondingly decreased net loss by $420,000 in the forth quarter of 2015. The Company's management assessed the impact of such errors on the financial statements and determined that the errors in the second quarter of 2015 and the related correction in the fourth quarter 2015 did not have a material impact on the Company's financial statements for each of those quarters. Therefore, the Company's management determined that no restatement of prior filings is necessary.
The Company discontinued the Gel Perfect nail polish brand in fiscal 2014 which is reported as discontinued operations in the statement of operations for the each of the quarters for the years in fiscal 2015.
|
| | | | | | | | | | | | | | | | |
| | | | Three Months Ended | | |
Fiscal 2014 | | Feb. 28 | | May 31 | | Aug. 31 | | Nov. 30 |
Net Sales | | 8,068,006 |
| | 8,761,946 |
| | 7,807,019 |
| | 5,483,328 |
|
Total Revenue | | 8,304,928 |
| | 8,769,567 |
| | 8,017,261 |
| | 5,486,789 |
|
Cost of Sales | | 1,326,852 |
| | 5,338,683 |
| | 4,069,779 |
| | 2,894,912 |
|
Gross Profit | | 6,741,154 |
| | 3,423,263 |
| | 3,737,240 |
| | 2,588,416 |
|
Income (Loss) from Continued Operations | | $ | 2,750,295 |
| | $ | (1,678,514 | ) | | $ | (199,110 | ) | | $ | (3,676,099 | ) |
(Loss) Income from Discontinued Operations | | (3,838,474 | ) | | (2,458,192 | ) | | 887,221 |
| | (586,596 | ) |
Net (Loss) Income | | (1,088,179 | ) | | (4,136,706 | ) | | 688,111 |
| | (4,262,695 | ) |
Earnings (Loss) Per Share: | | | | | | | | |
Basic | | | | | | | | |
Continuing Operations | | $ | 0.39 |
| | $ | (0.24 | ) | | $ | (0.03 | ) | | $ | (0.52 | ) |
Discontinued Operations | | $ | (0.55 | ) | | $ | (0.35 | ) | | $ | 0.13 |
| | $ | (0.08 | ) |
Total (loss) per share | | $ | (0.16 | ) | | $ | (0.59 | ) | | $ | 0.10 |
| | $ | (0.60 | ) |
Diluted | | | | | | | | |
Continuing Operations | | $ | 0.39 |
| | $ | (0.24 | ) | | $ | (0.03 | ) | | $ | (0.52 | ) |
Discontinued Operations | | $ | (0.55 | ) | | $ | (0.35 | ) | | $ | 0.13 |
| | $ | (0.08 | ) |
Total (loss) per share | | $ | (0.16 | ) | | $ | (0.59 | ) | | $ | 0.1 |
| | $ | (0.60 | ) |
The Company discontinued the Gel Perfect nail polish brand and sold the Mega-T dietary supplement brand, both of which are reported as discontinued operations in the statement of operations for the each of the quarters for the years in fiscal 2014.
Item 9. CHANGES IN AND DISAGREEMENTS WITH ACCOUNTANTS ON ACCOUNTING AND FINANCIAL DISCLOSURE
During the Company’s fiscal years ended November 30, 2015, 2014, and 2013 there were (i) no disagreements between the Registrant and the Company's independent registered public accounting firm, BDO USA LLP, on any matter of accounting principles or practices, financial statement disclosures or auditing scope or procedure, which, if not resolved to the satisfaction of BDO USA LLP would have caused BDO USA LLP to make reference thereto in their reports on the financial statements for such years, and (ii) no “reportable events” as that term is defined in Item 304(a)(1)(v) of Regulation S-K.
Item 9A. CONTROLS AND PROCEDURES
Under Section 404 of the Sarbanes-Oxley Act of 2002, the Company’s fiscal 2015 annual report is required to be accompanied by a “Section 404 Formal Report” by management on the effectiveness of internal controls over financial reporting. The Company’s officers evaluate and confirm the effectiveness of the Company’s internal controls over financial reporting, that the Company’s data processing software systems and other procedures are effective and that the information created by the Company’s systems adequately confirm the validity of the information upon which the Company relies.
The Company regularly reviews the effectiveness of its internal controls and procedures, including financial reporting. It works to strengthen its procedures wherever necessary.
The Company has established disclosure controls and procedures designed to provide reasonable assurance that information required to be disclosed in the reports that the Company files or submits under the Securities Exchange Act of 1934, as amended (the “Exchange Act”) is recorded, processed, summarized and reported within the time periods specified in the SEC’s rules and forms and is accumulated and communicated to management, including the principal executive officer (our Chief Executive Officer) and principal financial officer (our Chief Financial Officer), to allow timely decisions regarding required disclosure. Notwithstanding the foregoing, there can be no assurance that the Company’s disclosure controls and procedures will detect or uncover all failures of persons within the Company to disclose material information otherwise required to be set forth in the Company’s periodic reports. There are inherent limitations to the effectiveness of any system of disclosure controls and procedures, including the possibility of human error and the circumvention or overriding of the controls and procedures. Accordingly, even effective disclosure controls and procedures can only provide reasonable, not absolute, assurance of achieving their control objectives.
An evaluation was performed under the supervision of the Company’s management, including the Chief Executive Officer and Chief Financial Officer, of the effectiveness of the design and operation of the Company’s disclosure controls and procedures (as defined in the Exchange Act Rules 13a-15(e) and 15d-15(e)) as of the end of the period covered by this report. Based on that evaluation, the Company’s management, including the Chief Executive Officer and Chief Financial Officer, concluded that, as of November 30, 2015, the Company’s disclosure controls and procedures were effective at the reasonable assurance level to ensure that information we are required to disclose in reports that we file or submit under the Exchange Act is recorded, processed, summarized and reported within the time periods specified in the Commission’s rules and forms, and is accumulated and communicated to our management, including the Chief Executive Officer and Chief Financial Officer, as appropriate, to allow timely decisions regarding required disclosure.
This annual report does not include an attestation report of the Company’s independent registered public accounting firm regarding internal control over financial reporting. Management’s report was not subject to attestation by the Company’s independent registered public accounting firm pursuant to rules of the SEC that pertain to smaller reporting companies, and permit the Company to provide only management’s report in this annual report.
Management’s Report on Internal Control Over Financial Reporting
Under Section 404 of the Sarbanes-Oxley Act of 2002, our management, including our Chief Executive Officer and Chief Financial Officer, are required to assess the effectiveness of the Company’s internal control over
financial reporting as of November 30, 2015 and report, based on that assessment, whether the Company’s internal control over financial reporting was effective.
Management of the Company is responsible for establishing and maintaining adequate internal control over financial reporting, as defined in Rules 13a-15(f) or 15d-15(f) under the Securities Exchange Act of 1934. The Company’s internal control over financial reporting is a process designed by, or under the supervision of, our Chief Executive Officer and Chief Financial Officer to provide reasonable assurance regarding the reliability of the Company’s financial reporting and the preparation of financial statements for external purposes in accordance with generally accepted accounting principles.
The Company’s internal control over financial reporting includes those policies and procedures that: (i) pertain to the maintenance of records that, in reasonable detail, accurately and fairly reflect the transactions and dispositions of the assets of the Company; (ii) provide reasonable assurance that transactions are recorded as necessary to permit preparation of financial statements in accordance with generally accepted accounting principles, and that receipts and expenditures of the Company are being made only in accordance with authorizations of management and directors of the Company; and (iii) provide reasonable assurance regarding prevention or timely detection of unauthorized acquisition, use or disposition of the Company’s assets that could have a material effect on the financial statements.
Internal control over reporting, because of its inherent limitations, may not prevent or detect misstatements. Projections of any evaluation of effectiveness for future periods are subject to the risk that controls may become inadequate because of changes in conditions, or that the degree of compliance with the policies or procedures may deteriorate.
The Company’s management has assessed the effectiveness of its internal control over financial reporting as of November 30, 2015 using the criteria as set forth in Internal Control – Integrated Framework by the Committee of Sponsoring Organizations of the Treadway Commission (2013 framework). The Company’s assessment included documenting, evaluating and testing of the design and operating effectiveness of its internal control over financial reporting. Management of the Company has reviewed the results with the Audit Committee of the Board of Directors.
Based on the Company’s assessment, management has concluded that, as of November 30, 2015, the Company’s internal control over financial reporting was effective.
/s/ LANCE FUNSTON
Lance Funston, Chief Executive Officer
/s/ STEPHEN A. HEIT
Stephen A. Heit, Chief Financial Officer
Changes in Internal Control over Financial Reporting
No changes in the Company’s internal control over financial reporting (as defined in Rules 13a-15(f) and 15d-15(f) under the Exchange Act) occurred during the fiscal quarter ended November 30, 2015 that have materially affected, or are reasonably likely to materially affect, the Company’s internal control over financial reporting.
ITEM 9B. OTHER INFORMATION
None
PART III
Item 10. DIRECTORS, EXECUTIVE OFFICERS AND CORPORATE GOVERNANCE
The Executive Officers and Directors of the Company are as follows:
|
| | | | |
| | | | |
NAME | | POSITION | | YEAR OF FIRST COMPANY SERVICE |
| | |
Lance T. Funston | | Chairman of the Board of Directors and Chief Executive Officer | | 2015 |
Stephen A. Heit | | Chief Financial Officer and Treasurer. | | 2005 |
Sardar Biglari | | Director (resigned July 1, 2014, reappointed October 2, 2015) | | 2011 |
Philip Cooley | | Director resigned July 1, 2014, reappointed October 2, 2015) | | 2011 |
S. David Fineman | | Director | | 2015 |
Christopher Hogg | | Director | | 2015 |
Lance T. Funston, 73 years old is the Company's Chairman of the Board and Chief Executive Officer. Mr. Funston also serves as Chairman and CEO of Ultimark Products, LLC which he founded in 2000. The consumer products company manufactures and distributes Prell®, Denorex®, Zincon® and Porcelana®. In 1993 he founded TelAmerica Media, a media aggregator representing over 90% of the cable television industry. In 2008, 85% of the company was sold to Cross MediaWorks, Inc., the balance was sold to the Lee Group in 2013. Mr. Funston attended the University of Houston and received his Bachelor of Science degree in 1967. In 1967, Mr. Funston was appointed Assistant to the Director of the Federal Deposit Insurance Corporation by President Lyndon Johnson, and subsequently as special assistant to a governor of the Federal Reserve Board. Mr. Funston attended Harvard Business School, receiving his MBA in 1970. During his tenure at Harvard, he founded Portfolio Management Systems Incorporated, which developed investment management systems for major financial institutions including: John Hancock, Fidelity Mutual, American General, Sun Life, and Bank of America. In 1973 Portfolio Management created a private real estate equity fund in Houston, Texas and developed residential and commercial properties during a 10 year period. He also served as a board member of the United States Bobsled and Skeleton Federation from 1992 to 1996. In 2007, Lance and his wife, Christina, founded the Save a Mind Foundation, a 501(c)3 federal non-profit organization that assists at-risk youth in grades 5-8 to stay in school with their innovative Win/Win Program.
Director Qualifications
| |
• | Extensive experience in the consumer products market segment |
| |
• | Substantial experience in television advertising |
| |
• | Demonstrated leadership of numerous companies and organizations |
Stephen A. Heit, 61 years old, joined CCA in May 2005 as Executive Vice President – Operations, and was appointed Chief Financial Officer in March 2006. Prior to that he was Vice President – Business Strategies for Del Laboratories, Inc., a consumer products company that was listed on the American Stock Exchange, from 2003 to 2005. Mr. Heit served as President of AM Cosmetics, Inc. from 2001 to 2003 and as Chief Financial Officer from 1998 to 2003. From 1986 to 1997 he was the Chief Financial Officer of Pavion Limited, and also served on the Board of Directors. He served as a Director of Loeb House, Inc., a non-profit organization serving mentally handicapped adults from 1987 to 1995, and Director of Nyack Hospital Foundation from 1993 to 1995. He received a Bachelor of Science from Dominican College in 1976, with additional graduate work in Professional Accounting at Fordham University, and received an MBA in accounting from the University of Connecticut Graduate Business School.
Director Qualifications
| |
• | Extensive leadership experience in consumer products companies |
| |
• | Previous experience serving on the board of directors of a consumer products company |
| |
• | Substantial financial experience |
Sardar Biglari, 38 years old, is a director of the Company. He is Founder, Chairman and Chief Executive Officer of Biglari Holdings Inc. (“Biglari Holdings”), a diversified holding company. Mr. Biglari is also Founder, Chairman and Chief Executive Officer of Biglari Capital Corp., general partner of The Lion Fund, L.P. and The Lion Fund II, L.P., private investment funds, since its inception in 2000. On November 14, 2014, Lance T. Funston entered into an agreement with the Lion Fund, L.P. and, for certain limited purposes, Sardar Biglari and Philip L. Cooley (the “Agreement”). The Agreement provided that if the Company’s Board of Directors nominates Messrs. Biglari and Cooley to the Board, they will accept the nomination and serve on the Board upon their election. See footnote 6 to the beneficial ownership table below under Item 12 for additional information regarding the Agreement.
Director Qualifications
| |
• | Mr. Biglari has extensive managerial and investing experience in a broad range of businesses. |
| |
• | Experience serving on the board of directors of public companies. |
| |
• | Deemed by the Board of Directors to be an "audit committee financial expert" as defined by the SEC rules and "financially sophisticated" as defined by the NYSE MKT rules. |
Philip L. Cooley, 72 years old, is a director of the Company. He has served as Vice Chairman of the Board of Biglari Holdings Inc. since April 2009 and as a director since March 2008. He was the Prassel Distinguished Professor of Business at Trinity University, San Antonio, Texas, from 1985 until his retirement in May 2012. Dr. Cooley served as an advisory director of Biglari Capital Corp., general partner of The Lion Fund, L.P., since 2000 and as Vice Chairman and a director of Western Sizzlin Corporation from March 2006 and December 2005, respectively, until its acquisition by Biglari Holdings Inc. in March 2010. Dr. Cooley earned a Ph.D. from Ohio State University, a MBA from the University of Hawaii and a BME from the General Motors Institute. Dr. Cooley is past president of the Eastern Finance Association, and serves on its board, and of the Southern Finance Association. He also serves on the board of the Financial Literacy of South Texas Foundation. On November 14, 2014, Lance T. Funston entered into an agreement with the Lion Fund, L.P. and, for certain limited purposes, Sardar Biglari and Philip L. Cooley (the “Agreement”). The Agreement provided that if the Company’s Board of Directors nominates Messrs. Biglari and Cooley to the Board, they will accept the nomination and serve on the Board upon their election. See footnote 6 to the beneficial ownership table below under Item 12 for additional information regarding the Agreement.
Director Qualifications
| |
• | Dr. Cooley has extensive business and investment knowledge and experience. |
| |
• | Experience serving on the boards of directors of public companies. |
| |
• | Author of more than 60 articles on financial topics, his work has appeared in the Journal of Finance, Journal of Business and others. He also has authored several books in finance. |
| |
• | Deemed by the Board of Directors to be an "audit committee financial expert" as defined by the SEC rules and "financially sophisticated" as defined by the NYSE MKT rules. |
S. David Fineman, 70 years old, is a senior partner of the Philadelphia law firm of Fineman Krekstein & Harris. He was the Chairman of the Public Policy Committee of the Urban Land Institute and continues to be a member. Mr. Fineman was appointed by the President of the United States and confirmed by the United States Senate in 1995 as one of nine Governors of the U.S. Postal Service and was Chairman of the Board of Governors from 2003 to 2005. He has served since 2010 as Chairman of the Board of DHL eCommerce USA, a wholly owned subsidiary of Deutsche Post, the largest mail consolidator of small parcels in the United States. He has been chosen by the United States District Court as a member of its Court-Annexed Early Mediation Program (from 1998 to present). In 2006 through 2014, Mr. Fineman was recognized among his peers and was named as one of Pennsylvania “Super Lawyers” for his expertise in Business Litigation and Government Relations. He was graduated from The American University (1967) where he presently serves on the Advisory Committee to the School of Public Affairs, and received his law degree,
with Honors, from The George Washington University (1970). He is presently a member of the Philadelphia, Pennsylvania and American Bar Associations and the Urban Land Institute.
Director Qualifications
| |
• | Mr. Fineman has extensive legal experience as senior partner of a law firm. |
| |
• | Substantial corporate governance knowledge as Chairman of the Board of DHL eCommerce USA. |
| |
• | Deemed by the Board of Directors to be an "audit committee financial expert" as defined by the SEC rules and "financially sophisticated" as defined by the NYSE MKT rules. |
Christopher Hogg, 57 years old, has been the entrepreneurial prime mover behind a number of businesses in the consumer financial services industry. Chris is an Australian citizen and resides in Bryn Mawr, PA, USA. His experience is based in the corporate insurance, consumer debt recovery, retail financial services, payroll and payments transaction services and consumer finance industries. Chris is currently Chairman of a new start up Insurance Company, Agency Bonding Captives Inc. underwriting Surety Guarantee and Contract Bonding business throughout the USA and is in the process of acquiring an existing licensed Insurer. Chris is a managing member of Global IT Sales LLC which currently is the controlling shareholder of Innovant Investment Group LLC. Innovant acquired 75% of EmployeeMax in June 2015, a payroll and HR services company with offices in Pennsylvania, Virginia and Texas.
Director Qualifications
| |
• | Extensive experience in the digital media and technology business |
| |
• | Leadership role in publicly held company |
Committees of the Board of Directors
The Board of Directors has established three committees. The audit committee is comprised solely of independent directors, Philip Cooley, who serves as its’ Chairman and S. David Fineman. Directors Cooley and Fineman each qualify as an “audit committee financial expert” as defined by the SEC, are “independent” as that term is used in Section 10(m)(3) of the Exchange Act and NYSE-MKT rules and are “financially sophisticated” as defined by NYSE-MKT rules. The compensation committee is comprised of Philip Cooley, S. David Fineman and Christopher Hogg. Each member of the compensation committee is “independent” as defined by NYSE-MKT rules. The nominating committee is comprised of Christopher Hogg and S. David Fineman.
Section 16(a) Beneficial Ownership Reporting Compliance
Section 16(a) of the Securities Exchange Act of 1934 requires our executive officers and directors and beneficial owners of more than ten percent of the Company’s Common Stock to file reports regarding ownership of the Company’s Common Stock with the SEC, and to furnish the Company with copies of all such filings. Based solely on a review of these filings, the Company believes that all filings were timely made in fiscal 2015, except for a late form 4 filed by Richard Kornhauser, the Company's former Chief Executive Officer on July 23, 2015 reporting one stock purchase, and form 3 failed to be filed by each director Christopher Hogg and S. David Fineman.
Code of Ethics
The Company had adopted Standards of Business Conduct (our code of ethics), which apply to all directors and employees of the Company, including the Chief Executive Officer and Chief Financial Officer. A copy of the Standard of Business Conduct may be found in the investor section of the Company’s web site, www.ccaindustries.com, under Corporate Governance. The Company intends to disclose any substantive amendments to the Standards of Business Conduct as well as any waivers from provisions such document made with respect to our Chief Executive Officer, Chief Financial Officer, any principal accounting officer, and any other executive officer or any director at the same web site location. A print copy of our Standards of Business Conduct will be provided to any person upon request and without charge by writing to the following address: CCA Industries Inc., 65 Challenger Road, Suite 340, Ridgefield Park, NJ 07660, Attention: Corporate Secretary.
Item 11. EXECUTIVE COMPENSATION
i. Summary Compensation Table
The following table summarizes compensation earned in the 2015, 2014 and 2013 fiscal years by the following named officers:
|
| | | | | | | | | | | | | | |
Name and Principal Position | | Year | | Salary ($) | | Bonus ($) (1) | | All Other Compensation ($) (2) | | Total ($) |
Richard Kornhauser, Chief Executive Officer and | | 2015 | | 540,000 |
| | — |
| | 221,463 |
| | 761,463 |
|
President (3) | | 2014 | | 456,000 |
| | 150,000 |
| | 148,728 |
| | 754,728 |
|
| | 2013 | | 58,846 |
| | — |
| | — |
| | 58,846 |
|
Stephen A. Heit, Chief Financial Officer | | 2015 | | 292,014 |
| | — |
| | 99,085 |
| | 391,099 |
|
and Executive Vice President | | 2014 | | 264,948 |
| | 24,000 |
| | 35,582 |
| | 324,530 |
|
| | 2013 | | 250,000 |
| | — |
| | 30,344 |
| | 280,344 |
|
| |
(1) | Bonus amounts represent amounts earned in each respective fiscal year, not necessarily paid in each year. |
| |
(2) | Includes the personal use value of Company leased automobiles, the value of Company-provided life insurance, health insurance that is made available to all employees and the fair market value of equity awards granted during each year. Please see Item. 11, Section v.—Employment Contracts/Compensation Program for further information regarding the compensation of Richard Kornhauser and Stephen A. Heit. |
| |
(3) | Richard Kornhauser resigned as Chief Executive Officer and President in January 2016. Lance Funston was appointed by the Board of Directors as Chief Executive Officer in January 2016 at a base salary of $350,000 per annum. Included in the "All Other Compensation" column for Mr. Kornhauser is $170,190 for the fair market value of stock options granted in fiscal 2015. The fiscal 2015 stock options granted to Mr. Kornhauser were subsequently forfeited. |
ii. Outstanding Management Equity Awards at 2015 Fiscal Year End
On February 1, 2014, the Company granted incentive stock options for 100,000 shares to Richard Kornhauser, its President and Chief Executive Officer at $3.40 per share. The closing price of the Company's stock on the date of the grant was $3.04 per share. The options vest in equal 20% increments commencing on October 17, 2014, and for each of the four subsequent anniversaries of such date. The options expire on January 31, 2019. The Company has estimated the fair value of the options granted to be $114,000 as of the grant date, which amount shall be amortized as an expense over a five year period.
On January 5, 2015, the Company granted incentive stock options for 35,000 shares to Stephen A. Heit, the Company's Chief Financial Officer, at $3.48 per share. The closing price of the Company's stock on the date of the grant was $3.48 per share. The options vest in equal 20% increments commencing one year after the date of grant, and for each of the four subsequent anniversaries of such date. The options expire on January 5, 2025. The Company had estimated the fair value of the options granted to be $59,567 as of the grant date, and is being amortized as an expense over a five year period.
There were no other stock options for named executive officers granted or options exercised during fiscal 2015.
iii. Compensation of Directors
The following table reports the fees earned or paid in cash to each director, with respect to their service as directors, during fiscal 2015. Our non-employee directors received no other compensation in fiscal 2015.
|
| | |
| |
Director | Year Ended Nov. 30, 2015 |
Josephine Belli (resigned October 9, 2015 ) | 12,000 |
|
Sardar Biglari (reappointed October 2, 2015) | 2,000 |
|
Philip Cooley (reappointed October 2, 2015) | 2,000 |
|
S. David Fineman (appointed October 13, 2015) | 1,000 |
|
Lance Funston (elected August 13, 2015) | 2,000 |
|
Christopher Hogg (elected August 13, 2015) | 3,000 |
|
Stanley Kreitman (departed October 2, 2015) | 33,000 |
|
Robert Lage (departed October 2, 2015) | 52,833 |
|
Effective November 2015, the Board of Directors approved the following fees: Chairman of the Audit, Compensation and Nominating Committees - $500 retainer per annum in addition to other director fees; Non-executive directors - $1,000 per in-person board meeting and no payment for attendance by telephone. The Board of Directors met four times in person during fiscal 2015, and four additional times by conference call, for an aggregate compensation of $107,833. Mr. Funston was appointed Chief Executive Officer of the Company in January, and accordingly will not receive any additional compensation as a director while he is an employee of the Company.
iv. Executive Compensation Principles—Compensation Committee
The Company’s Executive Compensation Program is based on guiding principles designed to align executive compensation with Company values and objectives, business strategy, management initiatives, and financial performance. In applying these principles the Compensation Committee of the Board of Directors, comprised of Philip Cooley and S. David Fineman has established a program to:
Reward executives for long-term strategic management and the enhancement of shareholder value.
Integrate compensation programs with both the Company’s annual and long-term strategic planning.
Support a performance-oriented environment that rewards performance not only with respect to Company goals but also Company performance as compared to industry performance levels.
The Compensation Committee has a charter, which may be found in the investor section of the Company’s web site, www.ccaindustries.com under Corporate Governance. Compensation, including annual bonus amounts, for the executive officers named in the Summary Compensation Table (other than the Chief Executive Officer), are recommended by the Chief Executive Officer, and approved by the Compensation Committee and the Board of Directors.
v. Employment Contracts/Compensation Program
The Compensation Committee (the “Committee”) determines the level of salary and bonuses, if any, for key executive officers of the Company. The Committee determines the salary or salary range based upon competitive norms. Actual salary changes are based upon performance, and bonuses, if any, are awarded by the Committee and
approved by the independent directors of the board in consideration of the employee’s performance during the fiscal year and, except for the Company’s Chief Executive Officer, upon the recommendation of the Company’s Chief Executive Officer.
On March 21, 2011, the Committee, acting on behalf of the Company, entered into an Employment Agreement (each, an “Employment Agreement”) with Stephen A. Heit, and Drew Edell (each, an “Executive”). Pursuant to their respective Employment Agreements, Mr. Heit was engaged to continue to serve as the Company’s Executive Vice President and Chief Financial Officer, and Mr. Drew Edell was engaged to continue to serve as the Company’s Executive Vice President, Product Development and Production.
Mr. Drew Edell is the son of David Edell, who was a member of the Board of Directors of the Company and served as a consultant to the Company. Except as set forth below, the Employment Agreements contain substantially similar terms to each other. The initial term of employment under each of the Employment Agreements ran from March 21, 2011 through December 31, 2013, with successive one-year renewal terms thereafter unless the Company or the Executive chooses not to renew the respective Employment Agreement. The Company chose not to renew the employment contract of Drew Edell, effective November 30, 2014. Under the terms of Drew Edell's Employment Agreement, as amended, he is entitled to certain payments and benefits, including a payment of his base salary for six months after termination and a lump-sum payment of $673,750, which is due to be paid in October 2016. Mr. Heit's contract was automatically renewed for 2016.
Under the respective Employment Agreements, the base salaries of Mr. Stephen A. Heit, and Mr. Drew Edell (the “Executives”) are $250,000 and $275,000 per annum, respectively, and may be increased each year at the discretion of the Company’s Board of Directors. Mr. Heit's base salary was increased to $280,000, effective October 1, 2014. The Executives are eligible to receive an annual performance-based bonus under their respective Employment Agreement, and are entitled to participate in Company equity compensation plans. In addition, each of the Executives will receive an automobile allowance, health insurance and certain other benefits. In the event of termination of the respective Employment Agreement as a result of the disability or death of the Executive, the Executive (or his estate or beneficiaries) shall be entitled to receive all base salary and other benefits earned and accrued until such termination as well as a single-sum payment equal to the Executive’s base salary and a single-sum payment equal to the value of the highest bonus earned by the Executive in the one-year period preceding the date of termination pro-rated for the number of days served in that fiscal year. If the Company terminates the Executive for Cause (as defined in the respective Employment Agreement), or the Executive terminates his employment in a manner not considered to be for Good Reason (as defined in the respective Employment Agreement), the Executive shall be entitled to receive all base salary and other benefits earned and accrued prior to the date of termination. If the Company terminates the Executive in a manner that is not for Cause or due to the Executive’s death or disability, the Executive terminates his employment for Good Reason, or the Company does not renew the Employment Agreement after December 31, 2013, the Executive shall be entitled to receive a single-sum payment equal to his unpaid base salary and other benefits earned and accrued prior to the date of termination and a single-sum payment of an amount equal to three times the average of the base salary amounts paid to Executive over the three calendar years prior to the date of termination. In addition, each Executive is entitled to certain benefits in connection with a Change of Control (as defined in their respective Employment Agreements).
Under the Employment Agreements, each Executive has agreed to non-competition restrictions for a period of six months following the end of the term of his Employment Agreement, during which period the Executive will be paid an amount equal to his base salary for a period of six months, and an amount equal to the pro rata share of any bonus attributable to the portion of the year completed prior to the date of termination. The Executives have also agreed to confidentiality and non-solicitation restrictions under the Employment Agreements.
The foregoing summary of the Employment Agreements is qualified in its entirety by the full text of the Employment Agreements, copies of which may be found in Form 8-K that was filed by Company on March 21, 2011 with the United States Securities and Exchange Commission.
The Company also entered into an Employment Agreement with another Company executive, who is not a “named executive officer” within the meaning of the Securities Exchange Act of 1934, as amended and related regulations. The additional Employment Agreement referred to in the preceding sentence contains substantially similar
terms as the Employment Agreements discussed above, except that the employee’s base salary is $135,000 per annum, which was increased to $140,000 in the fourth quarter of fiscal 2014.
In October 2013, Richard Kornhauser was appointed as Chief Executive Officer and President with a salary of $450,000 per annum. In January 2016, Mr. Kornhauser resigned as Chief Executive and President of the Company. The Company agreed to pay Mr. Kornhauser $280,000 in four payments during fiscal 2016 as severance payments.
In January 2016, Lance Funston was appointed Chief Executive Officer of the Company in addition to his responsibilities as Chairman of the Board. Mr. Funston's base salary is $350,000 per annum. There is no written employment agreement between the Company and Mr. Funston.
The Company was also party to an employment agreement providing for a consulting arrangement and change of control agreement with each of David Edell and Ira Berman, the two founding shareholders of the Company (the “Founders”). On September 5, 2014, the Company entered into Separation Agreements with the Founders terminating their employment agreements and their change in control agreements as of that date. In consideration for the termination of these agreements, the Company made a payment of $1,000,000 in the aggregate to the Founders in September 2014. The Company is further required under the Separation Agreements, as amended, to make an additional payment in the aggregate of $200,000 to the Founders on October 1, 2016 and to pay $794,620 in the aggregate in monthly installments commencing on October 3, 2014. The final monthly payment will be due in July 2016, The $794,620 represents the aggregate amount that had been due to Messrs. Edell and Berman through September 5, 2014 under their employment agreements, of which $794,620 had been previously reserved for in the Company’s financial statements. See Item 7 - Contractual Obligations and Item 13 for additional information regarding the consulting arrangement.
vi. Retirement Benefits
The Company has adopted a 401(K) Profit Sharing Plan that covers all employees with over one year of service and attained age 21, including the executive officers named in the Summary Compensation Table. Employees may make salary reduction contributions up to twenty-five percent of compensation not to exceed the federal government limits. The Plan allows for the Company to make discretionary contributions. For all fiscal periods reflected in the Summary Compensation Table, the Company did not make any contributions.
vii. Equity Plans
Long-term incentives may be provided through the issuance of stock options or other equity awards, as determined in the discretion of the Board of Directors or compensation committee.
On June 15, 2005, the shareholders approved an amended and Restated Stock Option Plan amending the 2003 Stock Option Plan (the “Plan”). The Plan authorizes the issuance of up to one million shares of common stock (subject to customary adjustments set forth in the plan) pursuant to equity awards, which may take the form of incentive stock options, nonqualified stock options restricted shares, stock appreciation rights and/or performance shares. The plan expired in April, 2015. On August 13, 2015, the shareholders approved the 2015 CCA Industries, Inc. Incentive Plan(the "2015 Plan"). The 2015 Plan authorizes the issuance of up to 700,000 shares of common stock plus any shares underlying outstanding awards under the prior plan that terminate or expire unexercised or are cancelled or forfeited(subject to customary adjustments set forth in the plan) pursuant to equity awards, which may take the form of incentive stock options, nonqualified stock options, stock appreciation rights, restricted stock, restricted stock units, performance shares and/or cash award.
On January 5, 2015, the Company granted incentive stock options for 175,000 shares to eight employees of the Company at $3.48 per share. The closing price of the Company's stock on the date of the grant was $3.48 per share. The options vest in equal 20% increments commencing one year after the date of grant, and for each of the four subsequent anniversaries of such date. The options expire on January 5, 2025. The Company had estimated the fair value of the options granted to be $297,833 as of the grant date. Subsequent to the grant date, 130,000 incentive stock option shares were forfeited, which had a fair market value of $221,247 at the time of the grant. The balance of 45,000 shares outstanding from the January 5, 2015 grant with a fair market value of $76,586 is being amortized as an expense
over a five year period. Accordingly, the Company recorded a charge against earnings in the amount of $14,041 for the fiscal year end November 30, 2015.
On April 9, 2015, the Company granted incentive stock options for 10,000 shares to an employee of the Company, at $3.18 per share. The closing price of the Company's stock on the date of grant was $3.18 per share. The options vest in equal 20% increments commencing one year after the date of grant, and for each of the four subsequent anniversaries of such date. The options expire on April 8, 2025. The Company has estimated the fair value of the options granted to be $15,418 as of the grant date, which amount shall be amortized as an expense over a five year period. Accordingly, the Company recorded a charge against earnings in the amount of $2,056 for the fiscal year end November 30, 2015.
Awards may be granted under the Plans to employees (including officers and directors who are also employees) and non-employee directors of the Company provided, however, that Incentive Stock Options may not be granted to any non-employee director or consultant.
The Plan is administered and interpreted by the Board of Directors. (Where issuance to a Board member is under consideration, that member must abstain.) The Board has the power, subject to plan provisions, to determine the persons to whom and the dates on which awards will be granted, the amount and vesting or exercise provisions of awards, and other terms. The Board has the power to delegate administration to a committee of not less than two (2) Board members, each of whom must be a “non-employee director” within the meaning of Rule 16b-3 under the Securities Exchange Act. Members of the Board receive no compensation for their services in connection with the administration of option plans.
The Plan permits the exercise of options for cash, or such other method as the Board may permit from time to time.
The maximum term of each option is ten (10) years. No option granted is transferable by the optionee other than upon death.
The exercise price of all options must be at least equal to one hundred percent (100%) of the fair market value of the underlying stock on the date of grant. The aggregate fair market value of stock of the Company (determined at the date of the option grant) for which any employee may be granted Incentive Stock Options in any calendar year may not exceed $100,000, plus certain carryover allowances. The exercise price of an Incentive Stock Option granted to any participant who owns stock possessing more than ten percent (10%) of the voting rights of the Company’s outstanding capital stock must be at least one hundred-ten percent (110%) of the fair market value on the date of grant. As of November 30, 2014, there were 137,000 outstanding stock options under the Plan.
viii. Performance Graph
Set forth below is a line graph comparing cumulative total shareholder return on the Company’s Common Stock, with the cumulative total return of companies in the Dow Jones US Index and the cumulative total return of Dow Jones’s Personal Products Index.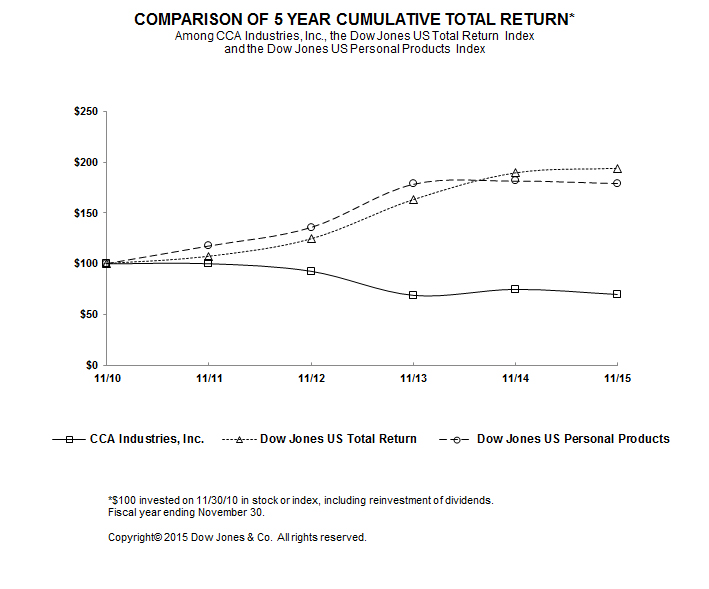
Copyright© 2015 Dow Jones & Company. All rights reserved.
|
| | | | | | | | | | | | | | | | | | |
| | 11/10 | | 11/11 | | 11/12 | | 11/13 | | 11/14 | | 11/15 |
CCA Industries, Inc. | | 100.00 |
| | 100.16 |
| | 92.68 |
| | 69.00 |
| | 74.91 |
| | 69.88 |
|
Dow Jones US Total Return | | 100.00 |
| | 107.30 |
| | 124.46 |
| | 163.03 |
| | 189.34 |
| | 193.85 |
|
Dow Jones US Personal Products | | 100.00 |
| | 117.48 |
| | 135.80 |
| | 178.53 |
| | 181.67 |
| | 179.29 |
|
The Performance Graph in this Item 11 is not deemed to be “soliciting material” or to be “filed” with the SEC or subject to Regulation 14A or 14C under the Securities Exchange Act of 1934 or to the liabilities of Section 18 of the Securities Exchange Act of 1934 and will not be deemed to be incorporated by reference into any filing under the Securities Act of 1933 or the Securities Exchange Act of 1934, except to the extent we specifically incorporate it by reference into such a filing.
Item 12. SECURITY OWNERSHIP OF CERTAIN BENEFICIAL OWNERS AND MANAGEMENT AND RELATED SHAREHOLDER MATTERS
The following table sets forth information as of November 30, 2015 with respect to compensation plans under which shares of the Company’s Common Stock may be issued:
EQUITY COMPENSATION PLAN INFORMATION
|
| | | | | | | | | | |
Plan Category | | Number of shares to be issued upon exercise of out- standing options warrants and rights | | Weighted- average exercise price of outstanding options | | Number of shares remaining and available for future issuance under equity compensation plans (excluding shares in the first column) |
Equity compensation plans approved by security holders | | 104,000 |
| | $ | 3.42 |
| | 700,000 |
|
Equity compensation plans not approved by security holders | | — |
| | — |
| | — |
|
Total | | 104,000 |
| | $ | 3.42 |
| | 700,000 |
|
The following table sets forth certain information regarding the ownership of the Company’s Common Stock, Class A Common Stock and ownership of all shares outstanding as of February 12, 2016 by (i) each of the directors (ii) each of the named executive officers listed in the summary compensation table and (iii) each person that the Company is aware to be the beneficial owner of more than five percent of the outstanding shares of Common Stock and/or Class A Common Stock and (iv) all current officers and directors as a group. Unless otherwise indicated, each of the shareholders has sole voting and investment power with respect to the shares owned (subject to community property laws, where applicable), and is the beneficial owner of them.
Beneficial Ownership of Equity Securities
|
| | | | | | | | | | | | |
| | | | | | Ownership | | Ownership | | Ownership | | Ownership |
| | Number of Shares Owned | | Percentage of | | Percentage of | | Percentage of | | Percent |
Name | | Common Stock | | Class A Common Stock | | Common Stock Outstanding | | Class A Stock Outstanding | | All Shares Outstanding | Option/Warrant Shares | Assuming Option/Warrant Exercise (5) |
Sardar Biglari (2) (6) | | 776,259 | | — | | 12.9% | | —% | | 11.1% | 75,000 | 12.0% |
Philip Cooley | | — | | — | | —% | | —% | | —% | 75,000 | 1.1% |
S. David Fineman | | — | | — | | —% | | —% | | —% | 75,000 | 1.1% |
Lance Funston (1) (6) | | 19,958 | | 967,702 | | 0.3% | | 100.0% | | 14.1% | — | 0.3% |
Stephen A. Heit | | 31,805 | | — | | 0.5% | | —% | | 0.5% | 35,000 | 0.9% |
Christopher Hogg | | — | | — | | —% | | —% | | —% | 75,000 | 1.1% |
Richard Kornhauser | | 192,361 | | — | | 3.2% | | —% | | 2.7% | 20,000 | 3.0% |
Renaissance Technologies LLC (3) | | 324,500 | | — | | 5.4% | | —% | | 4.6% | — | 4.3% |
Capital Preservation Solutions, LLC (4,5) | | — | | — | | —% | | —% | | —% | 1,892,744 | 21.3% |
Officers & Directors
As a Group (6 persons) | | 828,022 | | — | | 13.7% | | 100.0% | | 25.6% | 2,227,744 | 31.8% |
| |
(1) | Includes shares owned by Capital Preservation Holdings, LLC which is controlled by Lance Funston. |
| |
(2) | Based on information contained in Schedule 13-D/A filed on August 8, 2011with the SEC by Biglari Holdings Inc., the amount reported included 388,130 shares held by Biglari Holdings Inc. until July 1, 2013. Based upon information in SEC Form 4, on July 1, 2013, the 388,130 shares held by Biglari Holdings Inc. were acquired by the Lion Fund, L.P.(“The Lion Fund”), which when combined with the previous 388,129 shares held by the Lion Fund results in the total of 776,259 shares currently held by the The Lion Fund. Biglari Capital Corp. (“BCC”) is the general partner of The Lion Fund, L.P.. Sardar Biglari is the founder, Chairman and Chief Executive Officer of BCC and has investment discretion over the securities owned by The Lion Fund, L.P. By virtue of these relationships, BCC and Sardar Biglari may be deemed to beneficially own the 776,259 shares owned directly by The Lion Fund, L.P. BCC and Sardar Biglari each expressly and respectively disclaims beneficial ownership of such shares except to the extent of their respective pecuniary interest therein. The principal business address of each of Biglari Holdings, Inc., Sardar Biglari, BCC and The Lion Fund, L.P. is 17802 IH 10 West, Suite 400, San Antonio, Texas 78257. |
| |
(3) | Based on information contained on Form 13F-HR, filed on November 12, 2015 with the SEC by Renaissance Technologies LLC ("RTC") . Their principal address is 800 Third Avenue, New York, New York 10022. |
| |
(4) | Capital Preservation Solutions, LLC is owned by Lance Funston. On September 5, 2014, the Company entered into a Loan and Security Agreement (the “Agreement”) with Capital Preservation Solutions, LLC (“Capital”) for a $5,000,000 working capital line of credit and a term loan for working capital purposes not to exceed $1,000,000. Contemporaneously with the signing of the Agreement, the Company issued a Warrant to Purchase Common Stock (the “Warrant”) to Capital whereby Capital may acquire upon exercise of the Warrant 1,892,744 shares of the Company’s Common Stock. The Warrant may be exercised in whole or in part at any time during the exercise period which is five years from the date of the Warrant. The Warrant bears a purchase price of $3.17 per share, subject to adjustments. The loan under the Agreement was paid in full on December 4, 2015. |
| |
(5) | The number of “Option /Warrant Shares” represents the number of shares that could be purchased by, and upon exercise of unexercised options/warrants; and the percentage ownership figure denominated “Assuming Option/Warrant Exercise” assumes, per person, that unexercised options/warrants have been exercised and, thus, that subject shares have been purchased and are actually owned. In turn, the “assumed” percentage ownership figure is measured, for each owner, as if each had exercised such options, and purchased subject ‘option shares,’ and thus increased total shares actually outstanding, but that no other option owner had ‘exercised and purchased.’ |
| |
(6) | On November 14, 2014, Lance T. Funston entered into an agreement with the Lion Fund, L.P. (the “Lion Fund”) and, for certain limited purposes, Sardar Biglari and Philip L. Cooley (the “Agreement”). The Lion Fund holds 776,259 shares of the Company’s Common Stock (the “TLF Shares”), and Mr. Biglari is the founder, Chairman and Chief Executive Officer of Biglari Capital Corp., the Lion Fund’s general partner. The TLF Shares are held subject to the Agreement, the terms of which grant the Lion Fund the right to sell all or a portion of the TLF Shares to Mr. Funston or his affiliate at a purchase price of $6.00 per share for a period of 30 days after the Restricted Period End Date (as defined below). Pursuant to the Agreement, the Lion Fund has agreed to certain transfer restrictions on the TLF Shares until the earlier of (a) January 1, 2018 and (b) the occurrence of specified extraordinary transactions, including (i) the execution of a definitive agreement for, or the public announcement of, a sale of the Company in which stockholders will receive less than $6.00 per share (subject to adjustment for stock splits and combinations, stock dividends and similar transactions), or (ii) the bankruptcy of the Company (such earlier date, the “Restricted Period End Date”). The Lion Fund further agreed that, until the Restricted Period End Date, it would vote the TLF Shares in accordance with the Board’s recommendation on any proposal presented to stockholders. For additional information, see the Schedules 13D/A filed by Mr. Funston and the Lion Fund on November 14, 2014. |
Item 13. CERTAIN RELATIONSHIPS AND RELATED TRANSACTIONS, AND DIRECTOR INDEPENDENCE
During fiscal years 2015 and 2014, as per their respective Employment Agreements, the Company made payments of $211,832 and $381,460 each to David Edell and Ira Berman for consulting services provided during those years and certain other benefits as per their Employment Agreements. David Edell served as a director during fiscal 2014 until September 5, 2014. Ira Berman is a former director. On September 5, 2014, the Company entered into Separation Agreements with David Edell and Ira Berman, (the “Founders”) whereby they are no longer required to perform any consulting services pursuant to their Amended and Restated Employment Agreements. The Company made a payment of $1,000,000 in the aggregate to the Founders on the separation date and is required per the Separation Agreements, as amended, to make an additional payment of $200,000 in the aggregate to the Founders on October 1, 2016 and pay $794,620 in the aggregate in monthly installments of $52,975 commencing on October 3, 2014. See Item 7 - Contractual Obligations for additional information regarding the consulting arrangement.
On September 5, 2014, the Company entered into a Loan and Security Agreement (the “Agreement”) with Capital Preservation Solutions, LLC (“Capital”) for a $5,000,000 working capital line of credit and a term loan for working capital purposes not to exceed $1,000,000. Capital Preservation Solutions, LLC is owned by Lance Funston, who also is the managing partner of Capital Preservations Holdings, LLC which owns common stock and all of the Company's Class A common stock. Contemporaneously with the signing of the Agreement, the Company issued a Warrant to Purchase Common Stock (the “Warrant”) to Capital whereby Capital may acquire upon exercise of the Warrant 1,892,744 shares of the Company’s Common Stock. The Warrant may be exercised in whole or in part at any time during the exercise period which is five years from the date of the Warrant. The Warrant bears a purchase price of $3.17 per share, subject to adjustments. The working capital line of credit and term loan have been recorded on the consolidated balance sheet as of November 30, 2014 as from a related party. Interest and amortized financing costs in the amount of $1,735,967 was incurred to Capital and is recorded on the consolidated statement of operations for the year ended November 30, 2015 as interest expense from a related party. The working capital and term loan under the Agreement was paid in full on December 4, 2015, and the Agreement expired on December 5, 2015.
The Company signed an agreement in December 2014 with Funston Media Management Services, Inc., which is owned by Lance Funston, who is now the Company's Chairman of the Board and Chief Executive Officer. The agreement provided for Funston Media Management Services, Inc. to provide consumer advertising purchasing services and brand management for a fee equal to 7.5% of the advertising costs with a minimum fee of $256,200 for the contract period. The agreement also provided for a monthly management fee of $15,000, which was amended to $5,000 per month for the contract period. The agreement ended on November 19, 2015. The Company incurred costs in the amount of $316,200 for the 2015 fiscal year, of which $136,200 remains unpaid and is recorded as an accrued expense on the consolidated balance sheet as of November 30, 2015.
The independent directors of the Company are: Sardar Biglari, Philip Cooley, S. David Fineman and Christopher Hogg. There were no transactions, relationships or arrangements not disclosed in this item that were considered by the Company’s board of directors in determining the director’s independence.
Item 14. PRINCIPAL ACCOUNTANT FEES AND SERVICES
BDO USA, LLP (“BDO”) served as the Company’s independent registered public accounting firm for 2015 and 2014. The services performed by BDO in this capacity included conducting an audit in accordance with generally accepted audit standards of, and expressing an opinion on, the Company’s consolidated financial statements.
Audit Fees
BDO’s fees for professional services rendered in connection with the audit and review of Forms 10-K and all other SEC regulatory filings were $191,750 and $184,750 per annum, respectively, for each of the 2015 and 2014 fiscal years. The Company has paid and is current on all billed fees.
Audit Related Fees
There were no audit related fees in fiscal 2015 or fiscal 2014.
Tax Fees
BDO’s fees for professional services rendered in connection with Federal and State tax return preparation and other tax matters for the 2015 and 2014 fiscal years was $35,000 and $40,000, respectively, per annum.
All Other Fees
There were no other fees in fiscal 2015 or fiscal 2014.
Engagements Subject to Approval
Under its charter, the Audit Committee must pre-approve all subsequent engagements of our independent registered public accounting firm unless an exception to such pre-approval exists under the Securities Exchange Act of 1934 or the rules of the Securities and Exchange Commission. Each year, before a independent registered public accounting firm is retained to audit our financial statements, such service and the associated fee, is approved by the committee. At the beginning of the fiscal year, the Audit Committee will evaluate other known potential engagements of the independent registered public accounting firm, including the scope of the work proposed to be performed and the proposed fees, and approve or reject each service, taking into account whether the services are permissible under applicable law and the possible impact of each non-audit service on the independent registered public accounting firm’s independence from management. At each subsequent committee meeting, the committee will receive updates on the services actually provided by the independent registered public accounting firm, and management may present additional services for approval. The committee has delegated to the Chairman of the committee the authority to evaluate and approve engagements on behalf of the committee in the event that a need arises for pre-approval between committee meetings. If the Chairman so approves any such engagements, he will report that approval to the full committee at the next committee meeting.
PART IV
Item 15. EXHIBITS, FINANCIAL STATEMENTS, SCHEDULES
|
| | |
| (a) (1) | Financial Statements: |
Table of Contents, Report of Independent Registered Public Accounting Firm, Consolidated Balance Sheets as of November 30, 2015 and 2014, Consolidated Statements of Operations for the years ended November 30, 2015, 2014 and 2013, Consolidated Statements of Comprehensive (Loss) Income for the years ended November 30, 2015, 2014 and 2013, Consolidated Statements of Shareholders’ Equity for the years ended November 30, 2015, 2014 and 2013, Consolidated Statements of Cash Flows for the years ended November 30, 2015, 2014 and 2013, Notes to Consolidated Financial Statements.
Financial Statement Supplementary Information:
|
| | |
| (a) (2) | Schedule II: Valuation Accounts; Years Ended November 30, 2015, 2014 and 2013. |
|
| | |
| (a) (3) | Exhibits: The following exhibits are filed herewith or incorporated by reference |
(2.1) Asset Purchase Agreement, dated August 26, 2014, between CCA Industries, Inc. and Mega-T, LLC is incorporated by reference to Exhibit 2.1 to the Company’s Form 8-K filed September 2, 2014.
(3.1) The Company’s Articles of Incorporation and Amendments thereof, are incorporated by reference to its filing on Form 10-K/A filed April 5, 1995. (SEC file number reference 000-12723) (Exhibit pages 000001-23).
(3.2) The Company’s Bylaws are incorporated by reference to by reference to Exhibit 99.1 to the Company’s Form 8-K filed February 9, 2012.
(4.1) The Indenture (and the Promissory note exhibited therewith) defining the rights of former shareholders who tendered Common Stock to the Company for its $2 per share, five- year, 6% debenture, is incorporated by reference to the filing of such documents with the Schedule TO filed with the SEC, on June 7, 2000 (SEC file number reference 005-37409).
|
| |
(10.1) | Amended and Restated Employment Agreements of 1994, with David Edell and Ira Berman and the Company are incorporated by reference to the Company’s Form 10-K/A filed April 5, 1995 (SEC file number reference 000-12723). * |
|
| |
(10.2) | The February 1999 Amendments to the Amended and Restated Employment Agreements of David Edell and Ira Berman (1994) are incorporated by reference to the Company’s Form 10-K filed February 26, 1999 (SEC file number reference 000-12723) (Exhibit pages 00001-00002). * |
|
| |
(10.3) | License Agreement made February 12, 1986 with Alleghany Pharmacal Corporation is incorporated by reference to the Company’s Form 10-K/A filed April 5, 1995 (SEC file number reference 001-12723). |
|
| |
(10.4) | The Company’s 2005 Amended and Restated Stock Option Plan is incorporated by reference to its 2005 Proxy Statement (Exhibit A) filed May 2, 2005 (SEC file number reference 001-31643). * |
|
| |
(10.5) | The Employment Agreement, dated March 21, 2011, by and between the Company and Stephen A. Heit is incorporated by reference to Exhibit 10.2 to the Company’s Form 8-K filed March 31, 2011. * |
|
| |
(10.6) | The Employment Agreement, dated March 21, 2011, by and between the Company and Drew Edell is incorporated by reference to Exhibit 10.3 to the Company’s Form 8-K filed March 31, 2011. * |
|
| |
(10.11) | Warrant to Purchase Common Stock, dated as of September 5, 2014, by and between CCA Industries, Inc. and Capital Preservation Solutions, LLC is incorporated by reference to Exhibit 10.1 to the Company’s Form 8-K/A filed February 5, 2015. |
|
| |
(10.12) | Loan and Security Agreement, dated as of September 5, 2014, by and between CCA Industries, Inc. and Capital Preservation Solutions, LLC. is incorporated by reference to Exhibit 10.1 to the Company’s Form 8-K filed September 11, 2014. |
|
| |
(10.13) | Separation Agreement, dated as of September 5, 2014, by and between CCA Industries, Inc. and David Edell is incorporated by reference to Exhibit 10.3 to the Company’s Form 8-K filed September 11, 2014.* |
|
| |
(10.14) | Separation Agreement, dated as of September 5, 2014, by and between CCA Industries, Inc. and Ira Berman is incorporated by reference to Exhibit 10.4 to the Company’s Form 8-K filed September 11, 2014.* |
|
| |
(10.15) | Services Outsourcing Agreement between CCA Industries, Inc. and Emerson Healthcare, LLC, dated as of January 20,2014 is incorporated by reference to Exhibit 10.1 to the Company’s Form 10-Q filed April 14, 2014. |
|
| |
(10.16) | Sales Representation Agreement between CCA Industries, Inc. and S. Emerson Group, Inc., dated as of January 20, 2014 is incorporated by reference to Exhibit 10.2 to the Company’s Form 10-Q filed April 14, 2014. |
|
| |
(10.17) | Credit and Security Agreement, dated as of December 4, 2015, by and between CCA Industries, Inc. and SCM Specialty Finance Opportunities Funds, L.P. is incorporated by reference to Exhibit 10.1 to the Company's Form 8-K filed December 10, 2015. |
|
| |
(10.18) | Settlement Agreement and General Release between Richard Kornhauser and CCA Industries, Inc. is incorporated by reference to Exhibit 10.1 to the Company's Form 8-K filed January 25, 2016. |
|
| |
(11.00) | Statement re Per Share Earnings (included in Item 15, Financial Statements). |
|
| |
(31.1) | Certification of Chief Executive Officer pursuant to Rule 13a-14(a) included herein. |
|
| |
(31.2) | Certification of Chief Financial Officer pursuant to Rule 13a-14(a) included herein. |
|
| |
(32.1) | Certification of Chief Executive Officer pursuant to 18 U.S.C. 1350 included herein. |
|
| |
(32.2) | Certification of Chief Financial Officer pursuant to 18 U.S.C. 1350 included herein. |
|
| |
(101.Def) | Definition Linkbase Document † |
|
| |
(101.Pre) | Presentation Linkbase Document † |
|
| |
(101.Lab) | Labels Linkbase Document † |
(101.Cal) Calculation Linkbase Document †
(101.Sch) Schema Document †
(101.Ins) Instance Document †
|
| |
* | Management contract and compensatory plan or arrangement. |
Shareholders may obtain (without charge) a copy of this Annual Report on Form 10-K (including the financial statements and financial statement schedules) and a copy of any exhibit not filed herewith (upon payment of a fee limited to our reasonable expenses in furnishing such exhibit) by writing to CCA Industries, Inc., 65 Challenger Road, Suite 340, Ridgefield Park, New Jersey, 07660. The Company also makes the reports it files to be available in the Investor Relations section of its website (http://www.ccaindustries.com). Moreover, the public may read and copy any materials we file with the SEC (including the exhibits thereto) at the SEC’s Public Reference Room at 100 F Street, NE, Washington, DC 20549. You may obtain information on the operation of the Public Reference Room by calling the SEC at 1-800-SEC-0330. In addition, the SEC maintains an Internet site that contains reports, proxy and information statements, and other information regarding issuers that file electronically with the SEC (http://www.sec.gov).
SIGNATURES
Pursuant to the requirements of Section 13 or 15(d) of the Securities Exchange Act of 1934, the Registrant has duly caused this Annual Report to be signed on its behalf by the undersigned thereunto duly authorized.
|
| | |
| | |
CCA INDUSTRIES, INC. |
| |
By: | | /s/ LANCE FUNSTON |
| | LANCE FUNSTON, Chief Executive Officer and President |
| |
Date: | | February 29, 2016 |
Pursuant to the requirements of the Securities Exchange Act of 1934, this Annual Report has been signed below by the following persons on behalf of the Registrant and in the capacities and on the dates indicated.
|
| | | | |
| | | | |
Signature | | Title | | Date |
/s/ LANCE FUNSTON | | Chairman of the Board, Chief Executive Officer | | February 29, 2016 |
LANCE FUNSTON | | and President | | |
| | | | |
/s/ STEPHEN A. HEIT | | Director, Chief Financial Officer and Chief Accounting Officer | | February 29, 2016 |
STEPHEN A. HEIT | | | | |
| | | |
/s/ SARDAR BIGLARI | | Director | | February 29, 2016 |
SARDAR BIGLARI | | | | |
| | | |
/s/ PHILIP COOLEY | | Director | | February 29, 2016 |
PHILIP COOLEY | | | | |
| | | |
/s/ S. DAVID FINEMAN | | Director | | February 29, 2016 |
S. DAVID FINEMAN | | | | |
| | | |
/s/ CHRISTOPHER HOGG | | Director | | February 29, 2016 |
CHRISTOPHER HOGG | | | | |
| | | | |
| | | |
| | | | |
| | | | |
| | | |
| | | | |
| | | | |
CCA INDUSTRIES, INC. AND SUBSIDIARIES
CONSOLIDATED FINANCIAL STATEMENTS
NOVEMBER 30, 2015 AND 2014
C O N T E N T S
|
| |
| |
| |
| |
FINANCIAL STATEMENTS: | |
| |
| |
| |
| |
| |
| |
| |
| |
| |
| |
| |
| |
| |
SUPPLEMENTARY INFORMATION | |
| |
| |
| |
EXHIBITS | |
Report of Independent Registered Public Accounting Firm
Board of Directors and Shareholders
CCA Industries, Inc.
Ridgefield Park, New Jersey
We have audited the accompanying consolidated balance sheets of CCA Industries, Inc. and Subsidiaries as of November 30, 2015 and 2014 and the related consolidated statements of operations, comprehensive (loss), shareholders’ equity, and cash flows for each of the three years in the period ended November 30, 2015. In connection with our audits of the financial statements, we have also audited the financial statement schedule listed in the accompanying index. These financial statements and schedule are the responsibility of the Company’s management. Our responsibility is to express an opinion on these financial statements and schedules based on our audits.
We conducted our audits in accordance with the standards of the Public Company Accounting Oversight Board (United States). Those standards require that we plan and perform the audit to obtain reasonable assurance about whether the financial statements are free of material misstatement. The Company is not required to have, nor were we engaged to perform, an audit of its internal control over financial reporting. Our audits included consideration of internal control over financial reporting as a basis for designing audit procedures that are appropriate in the circumstances, but not for the purpose of expressing an opinion on the effectiveness of the Company’s internal control over financial reporting. Accordingly, we express no such opinion. An audit also includes examining, on a test basis, evidence supporting the amounts and disclosures in the financial statements, assessing the accounting principles used and significant estimates made by management, as well as evaluating the overall financial statement presentation of the financial statements and schedules. We believe that our audits provide a reasonable basis for our opinion.
In our opinion, the consolidated financial statements referred to above present fairly, in all material respects, the financial position of CCA Industries, Inc. and Subsidiaries at November 30, 2015 and 2014, and the results of its operations and its cash flows for each of the three years in the period ended November 30, 2015, in conformity with accounting principles generally accepted in the United States of America.
Also, in our opinion, the financial statement schedule, when considered in relation to the basic consolidated financial statements taken as a whole, present fairly, in all material respects, the information set forth therein.
/s/ BDO USA, LLP
Woodbridge, New Jersey
February 29, 2016
Part I - FINANCIAL INFORMATION
ITEM 1. - FINANCIAL STATEMENTS
CCA INDUSTRIES, INC. AND SUBSIDIARIES
CONSOLIDATED BALANCE SHEETS
|
| | | | | | | | |
| | November 30,
2015 | | November 30,
2014 |
ASSETS | | | | |
Current assets: | | | | |
Cash & cash equivalents | | $ | 509,884 |
| | $ | 241,621 |
|
Accounts receivable, net of allowances of $912,688 and $2,967,668 respectively | | 2,112,055 |
| | 2,248,301 |
|
Inventories, net of reserve for inventory obsolescence of $821,259 and $992,296, respectively | | 3,236,802 |
| | 5,181,490 |
|
Prepaid expenses and sundry receivables | | 697,097 |
| | 631,204 |
|
Prepaid and refundable income taxes | | 70,056 |
| | 453,598 |
|
Deferred income taxes | | 2,254,322 |
| | 2,883,285 |
|
Total Current Assets | | 8,880,216 |
| | 11,639,499 |
|
| | | | |
Property and equipment, net of accumulated depreciation | | 205,034 |
| | 1,108,600 |
|
Intangible assets, net of accumulated amortization | | 434,166 |
| | 654,840 |
|
Deferred financing fees, net of accumulated amortization | | — |
| | 1,341,458 |
|
Deferred income taxes | | 9,200,599 |
| | 6,988,195 |
|
Other | | 430,544 |
| | — |
|
Total Assets | | $ | 19,150,559 |
| | $ | 21,732,592 |
|
| | | | |
LIABILITIES AND CAPITAL | | | | |
Current Liabilities: | | | | |
Accounts payable & accrued liabilities | | $ | 7,645,553 |
| | $ | 10,731,031 |
|
Capitalized lease obligations - current portion | | 9,531 |
| | 7,642 |
|
Line of credit - related party | | 2,700,000 |
| | — |
|
Term loan - related party | | 1,000,000 |
| | — |
|
Total Current Liabilities | | 11,355,084 |
| | 10,738,673 |
|
| | | | |
Long-term accrued liabilities | | 1,242,282 |
| | — |
|
Line of credit - related party | | — |
| | 600,000 |
|
Term loan - related party | | — |
| | 805,813 |
|
Capitalized lease obligations | | 16,199 |
| | 22,152 |
|
Long term- other | | 147,853 |
| | — |
|
Total Liabilities | | 12,761,418 |
| | 12,166,638 |
|
| | | | |
Shareholders' Equity: | |
|
| |
|
|
Preferred stock, $1.00 par, authorized 20,000,000 none issued | | — |
| | — |
|
Common stock, $.01 par, authorized 15,000,000 shares, issued and outstanding 6,038,982 and 6,038,982 shares, respectively | | 60,390 |
| | 60,390 |
|
Class A common stock, $.01 par, authorized 5,000,000 shares, issued and outstanding 967,702 and 967,702 shares, respectively | | 9,677 |
| | 9,677 |
|
Additional paid-in capital | | 3,881,882 |
| | 3,814,484 |
|
Retained earnings | | 2,437,192 |
| | 5,681,403 |
|
Total Shareholders' Equity | | 6,389,141 |
| | 9,565,954 |
|
Total Liabilities and Shareholders' Equity | | $ | 19,150,559 |
| | $ | 21,732,592 |
|
See Notes to Consolidated Financial Statements.
CCA INDUSTRIES, INC. AND SUBSIDIARIES
CONSOLIDATED STATEMENTS OF OPERATIONS
|
| | | | | | | | | | | | | |
| | | Years Ended November 30, |
| | | 2015 | | 2014 | | 2013 |
Revenues: | | | | | | | |
Sales of health and beauty aid products - net | | | $ | 24,753,950 |
| | $ | 30,120,299 |
| | $ | 28,763,369 |
|
Other income | | | 35,605 |
| | 458,246 |
| | 63,794 |
|
Total Revenues | | | 24,789,555 |
| | 30,578,545 |
| | 28,827,163 |
|
Costs and Expenses: | | | | | | | |
Cost of sales | | | 10,445,369 |
| | 13,630,226 |
| | 12,302,356 |
|
Selling, general and administrative expenses | | | 11,574,045 |
| | 11,794,603 |
| | 18,345,284 |
|
Advertising, cooperative and promotional expenses | | | 3,524,074 |
| | 6,155,051 |
| | 2,921,199 |
|
Research and development | | | 75,208 |
| | 458,984 |
| | 741,694 |
|
Bad debt (recovery) expense | | | (20,730 | ) | | (24,721 | ) | | 55,204 |
|
Interest expense - related party | | | 1,735,967 |
| | 314,213 |
| | — |
|
Interest expense | | | 15,157 |
| | 22,259 |
| | 2,249 |
|
Total Costs and Expenses | | | 27,349,090 |
| | 32,350,615 |
| | 34,367,986 |
|
Restructuring Cost | | | 2,289,406 |
| | 2,738,570 |
| | — |
|
Total Costs and Expenses | | | 29,638,496 |
| | 35,089,185 |
| | 34,367,986 |
|
(Loss) before (benefit from) Income Taxes | | | (4,848,941 | ) | | (4,510,640 | ) | | (5,540,823 | ) |
(Benefit from) Income Taxes | | | (1,592,309 | ) | | (1,707,212 | ) | | (2,029,541 | ) |
(Loss) from Continuing Operations | | | (3,256,632 | ) | | (2,803,428 | ) | | (3,511,282 | ) |
Discontinued Operations | | | | | | | |
Income (loss) from discontinued operations | | | 18,494 |
| | (9,647,472 | ) | | (4,232,159 | ) |
Provision for (benefit from) Income Taxes | | | 6,073 |
| | (3,651,431 | ) | | (1,550,193 | ) |
Income (loss) from Discontinued Operations | | | 12,421 |
| | (5,996,041 | ) | | (2,681,966 | ) |
Net (loss) | | | $ | (3,244,211 | ) | | $ | (8,799,469 | ) | | $ | (6,193,248 | ) |
| | | | | | | |
(Loss) per Share: | | | | | | | |
Basic | | | | | | | |
Continuing Operations | | | $ | (0.46 | ) | | $ | (0.40 | ) | | $ | (0.50 | ) |
Discontinued Operations | | | $ | — |
| | $ | (0.86 | ) | | $ | (0.38 | ) |
Total (loss) per share | | | $ | (0.46 | ) | | $ | (1.26 | ) | | $ | (0.88 | ) |
| | | | | | | |
(Loss) per Share: | | | | | | | |
Diluted | | | | | | | |
Continuing Operations | | | $ | (0.46 | ) | | $ | (0.40 | ) | | $ | (0.50 | ) |
Discontinued Operations | | | $ | — |
| | $ | (0.86 | ) | | $ | (0.38 | ) |
Total (loss) per share | | | $ | (0.46 | ) | | $ | (1.26 | ) | | $ | (0.88 | ) |
| |
|
|
| |
|
| |
|
|
Weighted Average Shares Outstanding: | | | | | | | |
Basic | | | 7,006,684 |
| | 7,006,684 |
| | 7,037,694 |
|
Diluted | | | 7,006,684 |
| | 7,006,684 |
| | 7,037,694 |
|
See Notes to Consolidated Financial Statements.
CCA INDUSTRIES, INC. AND SUBSIDIARIES
CONSOLIDATED STATEMENTS OF COMPREHENSIVE (LOSS)
|
| | | | | | | | | | | | |
| | Years Ended November 30, |
| | 2015 | | 2014 | | 2013 |
(Loss) from Continuing Operations | | $ | (3,256,632 | ) | | $ | (2,803,428 | ) | | $ | (3,511,282 | ) |
Income (Loss) from Discontinuing Operations | | 12,421 |
| | (5,996,041 | ) | | (2,681,966 | ) |
Net (Loss) | | (3,244,211 | ) | | (8,799,469 | ) | | (6,193,248 | ) |
Other Comprehensive (Loss) Income | | | | | | |
Unrealized Gain (Loss) on Securities: | |
|
| |
|
| |
|
|
Unrealized holding gain arising during the period, net of tax | | — |
| | 36,888 |
| | 142,613 |
|
Less: reclassification adjustment for (gain) loss included in net income (loss), net of tax | | — |
| | (219,266 | ) | | 4,518 |
|
Comprehensive (Loss) (Note 3, Note 11) | | $ | (3,244,211 | ) | | $ | (8,981,847 | ) | | $ | (6,046,117 | ) |
Unrealized holding gain (loss) for the years ended November 30, 2015, 2014 and 2013, is net of deferred tax expense from unrealized gain of $0, $(21,581) and $(88,721), respectively.
The reclassification adjustment for (gain) loss for the years ended November 30, 2015, 2014 and 2013 is net of a deferred tax (expense) benefit of $0, $(128,244) and $2,668, respectively.
See Notes to Consolidated Financial Statements.
CCA INDUSTRIES, INC. AND SUBSIDIARIES
CONSOLIDATED STATEMENT OF SHAREHOLDERS' EQUITY
FOR THE YEARS ENDED NOVEMBER 2015, 2014 AND 2013
|
| | | | | | | | | | | | | | | | | |
| | | | | | | | | UNREALIZED | | |
| | | | | ADDITIONAL | | | | GAIN (LOSS) ON | | TOTAL |
| COMMON STOCK | | PAID IN | | RETAINED | | MARKETABLE | | SHAREHOLDERS' |
| SHARES | | AMOUNT | | CAPITAL | | EARNINGS | | SECURITIES | | EQUITY |
Balance – November 30, 2012 | 7,054,442 |
| | 70,544 |
| | 2,329,049 |
| | 21,813,136 |
| | 35,247 |
| | 24,247,976 |
|
Net loss for the year | — |
| | — |
| | — |
| | (6,193,248 | ) | | — |
| | (6,193,248 | ) |
Dividends declared | — |
| | — |
| | — |
| | (984,279 | ) | | — |
| | (984,279 | ) |
Unrealized gain on marketable securities, net of tax | — |
| | — |
| | — |
| | — |
| | 147,131 |
| | 147,131 |
|
Shares retired | (47,758 | ) | | (477 | ) | | | | (154,737 | ) | | | | (155,214 | ) |
Balance – November 30, 2013 | 7,006,684 |
| | 70,067 |
| | 2,329,049 |
| | 14,480,872 |
| | 182,378 |
| | 17,062,366 |
|
Net loss for the year | — |
| | — |
| | — |
| | (8,799,469 | ) | | — |
| | (8,799,469 | ) |
Deferred compensation | — |
| | — |
| | 29,035 |
| | — |
| | — |
| | 29,035 |
|
Unrealized gain on marketable securities, net of tax | — |
| | — |
| | — |
| | — |
| | (182,378 | ) | | (182,378 | ) |
Warrant issuance | — |
| | — |
| | 1,456,400 |
| | — |
| | — |
| | 1,456,400 |
|
Balance – November 30, 2014 | 7,006,684 |
| | 70,067 |
| | 3,814,484 |
| | 5,681,403 |
| | — |
| | 9,565,954 |
|
Net loss for the year | — |
| | — |
| | — |
| | (3,244,211 | ) | | — |
| | (3,244,211 | ) |
Deferred compensation | — |
| | — |
| | 67,398 |
| | — |
| | — |
| | 67,398 |
|
Balance - November 30, 2015 | 7,006,684 |
| | 70,067 |
| | 3,881,882 |
| | 2,437,192 |
| | — |
| | 6,389,141 |
|
See Notes to Consolidated Financial Statements.
CCA INDUSTRIES, INC. AND SUBSIDIARIES
CONSOLIDATED STATEMENTS OF CASH FLOWS
|
| | | | | | | | | | | |
| For the Years Ended November 30, |
| 2015 | | 2014 | | 2013 |
Cash Flows from Operating Activities: | | | | | |
Net (Loss) | $ | (3,244,211 | ) | | $ | (8,799,469 | ) | | $ | (6,193,248 | ) |
Adjustments to reconcile net (loss) to cash (used in) operating activities: | | | | | |
Depreciation and amortization | 151,250 |
| | 320,408 |
| | 324,212 |
|
Change in allowance for bad debts | (20,370 | ) | | (24,721 | ) | | 55,204 |
|
(Gain) loss on sale of securities | — |
| | (347,490 | ) | | 4,518 |
|
Loss on disposal or sale of property, plant and equipment | 852,606 |
| | 74,339 |
| | — |
|
Loss on write off of intangibles | 220,286 |
| | 90,248 |
| | — |
|
Debt discount amortization - related party | 194,184 |
| | 48,547 |
| | — |
|
Deferred financing fees amortization - related party | 970,931 |
| | 322,865 |
| | — |
|
Deferred financing fees amortization | 370,527 |
| | — |
| | — |
|
Deferred compensation | 67,398 |
| | 29,035 |
| | — |
|
Deferred income taxes | (1,583,441 | ) | | (5,342,123 | ) | | (3,673,004 | ) |
Change in Operating Assets & Liabilities: | | | | | |
Decrease in accounts receivable | 156,616 |
| | 3,249,872 |
| | 2,544,742 |
|
Decrease in inventory | 1,944,688 |
| | 3,426,077 |
| | 1,186,881 |
|
Decrease in insurance claim receivable | — |
| | — |
| | 800,000 |
|
(Increase) decrease in prepaid expenses and other receivables | (65,898 | ) | | (206,578 | ) | | 246,467 |
|
Decrease in prepaid income and refundable income tax | 383,542 |
| | 392,366 |
| | 66,288 |
|
(Increase) decrease in other assets | (430,544 | ) | | 8,000 |
| | 16,500 |
|
(Decrease) increase in accounts payable and accrued liabilities | (3,085,478 | ) | | 1,484,960 |
| | (1,016,882 | ) |
Increase in long-term liabilities | 1,242,282 |
| | | | |
Increase in other liabilities | 147,853 |
| | — |
| | — |
|
(Decrease) in income taxes payable | — |
| | — |
| | (9,440 | ) |
Net Cash (Used in) Operating Activities | (1,727,779 | ) | | (5,273,664 | ) | | (5,647,762 | ) |
Cash Flows from Investing Activities: | | | | | |
Acquisition of property, plant and equipment | (113,495 | ) | | (69,081 | ) | | (742,608 | ) |
Proceeds from sale of property, plant and equipment | 13,600 |
| | 72,613 |
| | — |
|
Purchase of marketable securities | — |
| | — |
| | (153,000 | ) |
Proceeds from sale and maturity of investments | — |
| | 1,170,909 |
| | 1,553,000 |
|
Net Cash (Used in) Provided by Investing Activities | (99,895 | ) | | 1,174,441 |
| | 657,392 |
|
Cash Flows from Financing Activities: | | | | | |
Proceeds from line of credit - related party | 2,100,000 |
| | 600,000 |
| | — |
|
Payments of deferred finance charges | — |
| | (450,656 | ) | | — |
|
Proceeds from term loan - related party | — |
| | 1,000,000 |
| | — |
|
Payments for capital lease obligations | (4,063 | ) | | (7,520 | ) | | (5,987 | ) |
Purchase of company stock and retirement | — |
| | — |
| | (155,214 | ) |
Dividends paid | — |
| | — |
| | (1,478,090 | ) |
Net Cash Provided by (Used in) Financing Activities | 2,095,937 |
| | 1,141,824 |
| | (1,639,291 | ) |
Net Increase (decrease) in Cash | 268,263 |
| | (2,957,399 | ) | | (6,629,661 | ) |
Cash and Cash Equivalents at Beginning of Period | 241,621 |
| | 3,199,020 |
| | 9,828,681 |
|
Cash and Cash Equivalents at End of Period | $ | 509,884 |
| | $ | 241,621 |
| | $ | 3,199,020 |
|
| | | | | |
|
| | | | | | | | | | | |
| | | | | |
| | | | | |
| | | | | |
| | | | | |
| For the Years Ended November 30, |
| 2015 | | 2014 | | 2013 |
Supplemental Disclosures of Cash Flow Information: | | | | | |
Cash paid during the period for: | | | | | |
Interest | $ | 1,380,598 |
| | $ | 25,529 |
| | $ | 2,249 |
|
Income taxes | $ | 59,107 |
| | $ | 564 |
| | $ | 40,200 |
|
Schedule of Non Cash Financing Activities: | | | | | |
Fixed assets acquired by capital leases | $ | — |
| | $ | — |
| | $ | 26,040 |
|
Warrants issued in connection with related party financing | $ | — |
| | $ | 1,456,400 |
| | $ | — |
|
Dividends declared | $ | — |
| | $ | — |
| | $ | 984,279 |
|
See Notes to Consolidated Financial Statements
CCA INDUSTRIES, INC. AND SUBSIDIARIES
NOTES TO CONSOLIDATED FINANCIAL STATEMENTS
NOTE 1 - ORGANIZATION AND DESCRIPTION OF BUSINESS
CCA Industries, Inc. (“CCA”) was incorporated in the State of Delaware on March 25, 1983.
CCA manufactures and distributes health and beauty aid products.
CCA has a few wholly-owned subsidiaries. CCA Online Industries, Inc. and CCA IND., S.A. DE C.V., a Variable Capital Corporation organized pursuant to the laws of Mexico, are currently inactive and will be dissolved.
NOTE 2 - SUMMARY OF SIGNIFICANT ACCOUNTING POLICIES
Principles of Consolidation:
The consolidated financial statements include the accounts of CCA and its wholly-owned subsidiaries (collectively the “Company”). All significant inter-company accounts and transactions have been eliminated.
Estimates and Assumptions:
The consolidated financial statements include the use of estimates, which management believes are reasonable. The process of preparing financial statements in conformity with accounting principles generally accepted in the United States (“GAAP”), requires management to make estimates and assumptions regarding certain types of assets, liabilities, revenues, and expenses. Such estimates primarily relate to unsettled transactions and events as of the date of the financial statements. Accounting estimates and assumptions are those that management considers to be most critical to the financial statements because they inherently involve significant judgment and uncertainties. All of these estimates and assumptions reflect management’s best judgment about current economic and market conditions and their effects on the information available as of the date of the consolidated financial statements. Accordingly, upon settlement, actual results may differ from estimated amounts.
Comprehensive (Loss):
Comprehensive (loss) includes changes in equity that are excluded from the consolidated statements of operations and are recorded directly into a separate section of consolidated statements of comprehensive (loss).
Cash and Cash Equivalents:
The Company considers all highly liquid instruments purchased with an original maturity of three months or less to be cash equivalents.
Accounts Receivable:
Accounts receivable consist of trade receivables recorded at original invoice amount, less an estimated allowance for uncollectible amounts. The accounts receivable balance is further reduced by an allowance for cooperative advertising and reserves for returns which are anticipated to be taken as credits against the balances as of November 30, 2015. The allowances and reserves which are anticipated to be deducted from future invoices are included in accrued liabilities. Trade credit is generally extended on a short term basis; thus trade receivables do not bear interest. Trade receivables are periodically evaluated for collectability based on past credit history with customers and their current financial condition. Changes in the estimated collectability of trade receivables are recorded in the results of operations for the period in which the estimate is revised. Trade receivables that are deemed uncollectible are offset against the allowance for uncollectible accounts. The Company generally does not require collateral for trade receivables.
Inventories:
Inventories are stated at the lower of cost (weighted average) or market. Product returns are recorded in inventory when they are received at the lower of their original cost or market, as appropriate. Obsolete inventory is written off and its value is removed from inventory at the time its obsolescence is determined.
CCA INDUSTRIES, INC. AND SUBSIDIARIES
NOTES TO UNAUDITED CONSOLIDATED FINANCIAL STATEMENTS
NOTE 2 - SUMMARY OF SIGNIFICANT ACCOUNTING POLICIES (continued)
Property and Equipment and Depreciation and Amortization:
Property and equipment are stated at cost. The Company charges to expense repairs and maintenance items, while major improvements and betterments are capitalized.
When the Company sells or otherwise disposes of property and equipment items, the cost and related accumulated depreciation are removed from the respective accounts and any gain or loss is included in earnings.
Depreciation and amortization are provided utilizing the straight-line method over the following estimated useful lives or lease terms of the assets, whichever is shorter:
|
| |
Machinery and equipment | 5-7 Years |
Furniture and fixtures | 3-10 Years |
Tools, dies and masters | 3 Years |
Transportation equipment | 5 Years |
Leasehold improvements | Shorter of the asset life or remaining life of the lease (4 years 8 months) |
Intangible Assets:
Intangible assets, which consist of patents and trademarks, are stated at cost. Patents are amortized on the straight-line method over a period of 17 years. Patents are reviewed for impairment when events or changes in business indicate that the carrying amount may not be recoverable. Trademarks are indefinite lived intangible assets and are reviewed for impairment annually or more frequently if impairment conditions occur. In the years ended November 30, 2015, November 30, 2014 and November 30, 2013, the Company determined that it would no longer use certain trademarks and recorded charges of $220,286, $90,248 and $0, respectively, to write off the related carrying amount which is recorded in selling, general and administrative expenses.
Long-Lived Assets:
Long-lived assets are assets in which the Company has an economic benefit for longer than twelve months from the date of the financial statement. Long-lived assets include property and equipment, intangible assets, deferred income taxes and other assets. The Company evaluates impairment losses on long-lived assets used in operations when events and circumstances indicate that the asset might be impaired. If the review indicates that the carrying value of an asset will not be recoverable, based on a comparison of the carrying value of the asset to the undiscounted future cash flows, the impairment will be measured by comparing the carrying value of the asset to its fair value. Fair value will be determined based on quoted market values, discounted cash flows or appraisals. Impairments are recorded in the statement of operations as part of selling, general and administrative expenses.
Revenue Recognition: (See also Cooperative Advertising)
The Company recognizes sales in accordance with ASC Topic 605 “Revenue Recognition”. Revenue is recognized upon shipment of merchandise. Net sales comprise gross revenues less expected returns, trade discounts, customer allowances and various sales incentives. Included in sales incentives are coupons that the Company issues that are redeemed by its customers. Redemptions are handled by a coupon national clearing house. The Company also has estimated that there is an approximate six week lag in coupon redemptions, with the estimated cost recorded as an accrued liability. Although no legal right of return exists between the customer and the Company, returns, including return of unsold products, are accepted if it is in the best interests of the Company's relationship with the customer. The Company, therefore, records a reserve for returns based on the historical returns as a percentage of sales in the five preceding months, adjusting for returns that can be put back into inventory, and a specific reserve based on customer circumstances. The reserves which are anticipated to be deducted from future invoices are included in accrued liabilities. Changes in the estimated coupon reserve and sales return reserve are recorded to Sales of health and beauty aid products - net, in the Consolidated Statement of Operations.
CCA INDUSTRIES, INC. AND SUBSIDIARIES
NOTES TO UNAUDITED CONSOLIDATED FINANCIAL STATEMENTS
NOTE 2 - SUMMARY OF SIGNIFICANT ACCOUNTING POLICIES (continued)
Cooperative Advertising:
Cooperative advertising is accrued based on a combination of new contracts given to the customers in the current fiscal year, along with what is left open from prior years. Specific new contracts in the current fiscal year are identified as sales incentives (see sales incentives) and those contracts reduce revenues for the current period. The open balances for all years open are reduced throughout the year by either the customer advertising and submitting the proof according to the contract or by customer post audit adjustments that finalize any amount due. Any item open more than three years is closed unless management believes that a deduction may still be taken by the customer. The balance of open cooperative advertising is then allocated between accrued liabilities and the allowance for cooperative advertising based the customer's open accounts receivable balance. As a result of completion of customer post audit reviews, open cooperative advertising that was accrued for in previous years was decreased by $670,513 for the fiscal year ended November 30, 2015. For fiscal year ended November 30, 2014 and 2013, the reserve for open cooperative advertising was decreased $786,306 and $816,418, respectively.
Sales Incentives:
The Company has accounted for certain sales incentives offered to customers by charging them directly to sales as opposed to advertising and promotional expense. These accounting adjustments do not affect net loss.
Shipping Costs:
The Company’s policy for financial reporting is to charge shipping costs as part of selling, general and administrative expenses as incurred. For the years ended November 30, 2015, 2014 and 2013 included in selling, general and administrative expenses are shipping costs of $616,367, $1,012,623 and $2,688,536, respectively.
Advertising Costs:
The Company’s policy for financial reporting is to charge advertising cost to expense as incurred. Advertising, cooperative and promotional expenses for the years ended November 30, 2015, 2014 and 2013 were $3,524,074, $6,155,051 and $2,921,199, respectively.
Research and Development Costs:
The Company's policy for financial reporting is to charge research and development costs to expense as incurred. Research and development costs for the years ended November 30, 2015, 2014 and 2013 were $75,208, $458,984 and $741,694, respectively.
Proceeds from Insurance Policy Claim:
The Company does not recognize insurance proceeds for losses incurred until the amounts are realizable. The Company records the insurance proceeds as a reduction in the underlying expense category where the losses were recognized. As a result of Super Storm Sandy, the Company made claims for loss against various insurance policies. In the case of one claim for $340,689, the Company did not determine the claim was realizable until May 2013 and received proceeds of $340,689 in June 2013. The Company recorded the proceeds as a reduction of selling, general and administrative expenses on the Consolidated Statements of Operations for the fiscal year ended November 30, 2013.
Income Taxes:
Income taxes are accounted for under ASC Topic 740 “Income Taxes”, which utilizes the asset and liability method. Deferred tax assets and liabilities are recognized for future tax consequences attributable to the temporary differences between the carrying amounts of assets and liabilities as recorded on the Company’s financial statements and the carrying amounts as reflected on the Company’s income tax return. In addition, the portion of charitable contributions that cannot be deducted in the current period and are carried forward to future periods are also reflected in the deferred tax assets. A substantial portion of the deferred tax asset is due to the losses incurred in fiscal 2015 and prior years, the benefit of which will be carried forward into future tax years. Deferred tax assets and liabilities are
CCA INDUSTRIES, INC. AND SUBSIDIARIES
NOTES TO UNAUDITED CONSOLIDATED FINANCIAL STATEMENTS
NOTE 2 - SUMMARY OF SIGNIFICANT ACCOUNTING POLICIES (continued)
valued using the tax rates expected to apply in the years in which those temporary differences are expected to be recovered or settled. Deferred tax assets are reduced by a valuation allowance when, in the opinion of management, it is more likely than not that some portion, or all of the deferred tax asset will not be realized. Management has estimated that it will utilize the entire deferred tax asset in future years based on projections of profits beginning in fiscal 2016. Management expects future profitability based on the outsourcing of many functions to The Emerson Group, a substantial reduction in personnel and a reduction in other expenses. However profits can be impacted in the future if the Company’s sales decrease. Management also considered that several one-time charges contributed to the loss in fiscal 2015. The portion that management expects to utilize in fiscal 2016 is recorded as a short term asset, and the portion that management expects to utilize in fiscal years subsequent to fiscal 2016 are recorded as a long term asset.
The Company previously adopted the provisions of ASC Subtopic 740-10-25, “Uncertain Tax Positions”. Management believes that there were no unrecognized tax benefits, or tax positions that would result in uncertainty regarding the deductions taken, as of November 30, 2015 and November 30, 2014. ASC Subtopic 740-10-25 prescribes a recognition threshold and a measurement attribute for the financial statement recognition and measurement of tax positions taken or expected to be taken in a tax return. For those benefits to be recognized, a tax position must be more-likely-than-not to be sustained upon examination by taxing authorities.
Tax Credits:
Tax credits, when present, are accounted for using the flow-through method as a reduction of income taxes in the years utilized.
(Loss) Per Common Share:
Basic (loss) per share is calculated in accordance with ASC Topic 260, “Earnings Per Share”, which requires using the average number of shares of common stock outstanding during the year. Diluted (loss) per share is computed on the basis of the average number of common shares outstanding plus the dilutive effect of any common stock equivalents using the “treasury stock method” and warrants. Common stock equivalents consist of stock options.
Stock Options:
ASC Topic 718, “Stock Compensation,” requires stock grants to employees to be recognized in the consolidated statement of operations based on their fair values. The Company issued stock options in fiscal 2015, see Note 18 for details.
Reclassifications:
Certain prior years amounts have been reclassified to conform with the current year’s presentation.
Recent Accounting Pronouncements
In February 2016, the Financial Accounting Standards Board ("FASB") issued Accounting Standards Update No. 2016-02, Leases. The new standard establishes a right-of-use (ROU) model that requires a lessee to record a ROU asset and a lease liability on the balance sheet for all leases with terms longer than 12 months. Leases will be classified as either finance or operating, with classification affecting the pattern of expense recognition in the income statement. The new standard is effective for fiscal years beginning after December 15, 2018, including interim periods within those fiscal years. A modified retrospective transition approach is required for lessees for capital and operating leases existing at, or entered into after, the beginning of the earliest comparative period presented in the financial statements, with certain practical expedients available. While we are still evaluating the impact of our pending adoption of the new standard on our consolidated financial statements, we expect that upon adoption we will recognize ROU assets and lease liabilities and that the amounts could be material.
CCA INDUSTRIES, INC. AND SUBSIDIARIES
NOTES TO UNAUDITED CONSOLIDATED FINANCIAL STATEMENTS
NOTE 2 - SUMMARY OF SIGNIFICANT ACCOUNTING POLICIES (continued)
In November 2015, the FASB issued ASU 2015-17, which is an update to Topic 740, "Income Taxes". The update will require that all deferred tax assets and liabilities be classified as non-current. The update is effective for fiscal years, and the interim periods within those years, beginning after December 15, 2016. ASU 2015-17 will have a material impact on the Company's balance sheet, as the deferred tax reported as a current asset will be reported as a non-current asset once the update is effective, resulting in a decrease to the Company's current ratio. As of November 30, 2015, the Company reported 2,254,322 of deferred tax as a current asset. It is not expected to have a material impact on the Company's results of operations.
In August 2015, the FASB issued ASU 2015-14, which is an update to Topic 606, "Revenue from Contracts with Customers". In May 2014, Financial Accounting Standards Board (“FASB”) issued Accounting Standards Update ("ASU") 2014-09, "Revenue from Contracts with Customers". ASU 2014-09 is a comprehensive new revenue recognition model that requires a company to recognize revenue to depict the transfer of good or services to a customer at an amount that reflects the consideration it expects to receive in exchange for those goods or services. ASU 2015-14 changes the effective date to annual reporting periods beginning after December 15, 2017, and including interim period within that period. Early adoption is permitted for annual reporting periods beginning after December 15, 2016 and including interim reporting periods within that period. Companies may use either a full retrospective or modified retrospective approach to adopt this ASU and our management is currently evaluating which transition approach to use. We are currently evaluating the impact of adopting ASU 2015-14 on our consolidated financial statements and related disclosures.
Management does not believe that any recently issued, but not yet effective, accounting standards if currently adopted would have a material effect on the accompanying financial statements.
CCA INDUSTRIES, INC. AND SUBSIDIARIES
NOTES TO UNAUDITED CONSOLIDATED FINANCIAL STATEMENTS
NOTE 3 - INVENTORIES
The components of inventory consist of the following:
|
| | | | | | | | |
| | November 30,
2015 | | November 30,
2014 |
Raw materials | | $ | 1,022,516 |
| | $ | 2,408,220 |
|
Finished goods | | 2,214,286 |
| | 2,773,270 |
|
| | $ | 3,236,802 |
| | $ | 5,181,490 |
|
At November 30, 2015 and November 30, 2014, the Company had a reserve for obsolescence of $821,259 and $992,296, respectively.
NOTE 4 - PROPERTY AND EQUIPMENT
The components of property and equipment consisted of the following:
|
| | | | | | | | |
| | November 30,
2015 | | November 30,
2014 |
Furniture and equipment | | 459,786 |
| | 672,477 |
|
Tools, dies and masters | | 462,542 |
| | 449,862 |
|
Transportation equipment | | — |
| | 16,538 |
|
Capitalized lease obligations | | 15,286 |
| | 41,326 |
|
Leasehold improvements | | 35,017 |
| | 1,054,365 |
|
| | $ | 972,631 |
| | $ | 2,234,568 |
|
Less: Accumulated depreciation | | 767,597 |
| | 1,125,968 |
|
Property and Equipment—Net | | $ | 205,034 |
| | $ | 1,108,600 |
|
Depreciation expense for the years ended November 30, 2015, 2014 and 2013 amounted to $150,862, $303,303 and $303,750, respectively. Due to the Companies move in April 2015 from its facility in East Rutherford, New Jersey to new offices in Ridgefield Park, New Jersey, the Company wrote off $714,138 of leasehold improvements pertaining to the East Rutherford facility in the second quarter of fiscal 2015. In addition, the Company wrote off $146,831 of furnishings and equipment that were not needed in the new facility.
NOTE 5 - INTANGIBLE ASSETS
Intangible assets consist of owned trademarks and patents for ten product lines.
|
| | | | | | | | |
| | November 30,
2015 | | November 30,
2014 |
Patents and trademarks | | $ | 580,007 |
| | $ | 800,293 |
|
Less: Accumulated amortization | | 145,841 |
| | 145,453 |
|
Intangible Assets - Net | | $ | 434,166 |
| | $ | 654,840 |
|
Patents are amortized on a straight-line basis over their legal life of 17 years. Trademarks have an indefinite life and are reviewed annually for impairment or more frequently if impairment indicators occur. During the fiscal years ended November 30, 2015 and 2014, the Company write off $220,286 and $90,248 of patents and trademarks, as part of its annual evaluation of patents and trademarks that were no longer in use and did not have any plans for future use. Amortization expense for the fiscal years ended November 30, 2015, 2014 and 2013, was $388, $17,105 and $20,462,
respectively. Estimated amortization expense for the years ending November 30, 2016, 2017, 2018, 2019 and 2020 are $388, $388, $388, $376 and $376, respectively.
NOTE 6 - ACCRUED EXPENSES
The following items which exceeded 5% of total current liabilities are included in accrued expenses as of:
|
| | | | | |
| November 30,
2015 | | November 30,
2014 |
Coop advertising | $1,697,493 | | $2,368,808 |
Restructuring Costs | 1,256,781 |
| | 1,043,897 |
|
Accrued returns | 407,992 |
| | 653,855 |
|
The following items which exceeded 5% of total long-term liabilities are included in accrued expenses as of:
|
| | | | | |
| November 30,
2015 | | November 30,
2014 |
Media advertising | $500,000 | | — |
|
Restructuring Costs | 420,000 |
| | — |
|
Sub-lease rent differential | 322,282 |
| | — |
|
CCA INDUSTRIES, INC. AND SUBSIDIARIES
NOTES TO UNAUDITED CONSOLIDATED FINANCIAL STATEMENTS
NOTE 7 - DEBT AGREEMENT
On September 5, 2014, the Company entered into a Loan and Security Agreement (the “Agreement”) with Capital Preservation Solutions, LLC (“Capital”) for a $5,000,000 working capital line of credit and a term loan for working capital purposes not to exceed $1,000,000. The line of credit and term loan had an interest rate of 6% and matured on December 5, 2015. The line of credit and term loan with Capital were paid in full on December 4, 2015 (see Note 20 - Subsequent Events for further information). The advances made under these loan agreements were subject to a borrowing base calculation that included 80% of the eligible accounts receivable plus 50% of the value of the eligible inventory. All amounts outstanding under these agreements were secured by a first priority security interest in all of the assets of the Company. Capital is owned by Lance Funston, the Chairman of the Board and Chief Executive Officer of the Company, who is also the managing partner of Capital Preservation Holdings, LLC, which owns 219,958 shares of the Company's common stock and all of the Class A common stock. Accordingly, the line of credit and term loan are shown on the consolidated balance sheet as from a related party.
Contemporaneously with the signing of the Agreement, the Company issued a Warrant to Purchase Common Stock (the “Warrant”) to Capital whereby Capital may acquire upon exercise of the Warrant 1,892,744 shares of the Company’s Common Stock. The Warrant may be exercised in whole or in part at any time during the exercise period which is five years from the date of the Warrant. The Warrant bears a purchase price of $3.17 per share, subject to adjustments. The value of the Agreement was allocated to the relative fair values of the Loan and Security Agreement and Warrant, resulting in an allocation of value to the Warrant of $1,456,400, which was recorded on the financial statements as additional paid-in capital as of September 5, 2014, with an asset of $1,213,667 recorded as deferred financing fees and a reduction of Term Loan- Related Party of $242,733 recorded as debt discount. The deferred financing fees and related debt discount were fully amortized as of November 30, 2015. At closing the Company executed a warrant agreement that was exercisable into a variable number of shares. The term was not consistent with the terms agreed to with the lender. The Warrant was corrected in January 2015. The Company has accounted for the transaction as if the corrected Warrant agreement was issued at closing.
NOTE 8 - OTHER INCOME
Other income consists of the following: |
| | | | | | | | | | | | |
| | November 30, |
| | 2015 | | 2014 | | 2013 |
Interest income | | 307 |
| | $ | 5,089 |
| | $ | 17,762 |
|
Dividend Income | | — |
| | 13,074 |
| | 28,668 |
|
Realized gain (loss) on sale of securities | | — |
| | 347,490 |
| | (4,518 | ) |
Royalty income | | 12,000 |
| | 12,230 |
| | 21,036 |
|
Miscellaneous | | 23,298 |
| | 80,363 |
| | 846 |
|
Total Other income | | $ | 35,605 |
| | $ | 458,246 |
| | $ | 63,794 |
|
NOTE 9 - 401(K) PLAN
The Company has a 401(K) Profit Sharing Plan for its employees. The Company previously had union employees who were terminated due to the closing of the warehouse. The Company had two separate 401 (K) plans, one for union and one for non-union employees. Effective January 1, 2015, the former union employees who had been members of the union plan were transferred into the non-union plan, and the union plan was terminated. The non-union plan requires six months of service. Employees must be 21 years or older to participate. Employees may make salary reduction contributions up to 25% of compensation not to exceed the federal government limits. The Plan allows for the Company to make discretionary contributions. For fiscal years 2015, 2014 and 2013, the Company did not make any contributions.
CCA INDUSTRIES, INC. AND SUBSIDIARIES
NOTES TO UNAUDITED CONSOLIDATED FINANCIAL STATEMENTS
NOTE 10 - INCOME TAXES
CCA and its subsidiaries file a consolidated federal income tax return.
The Company previously adopted the provisions of ASC Subtopic 740-10-25, “Uncertain Tax Positions”. Management believes that there were no unrecognized tax benefits, or tax positions that would result in uncertainty regarding the deductions taken, as of November 30, 2015 and November 30, 2014. ASC Subtopic 740-10-25 prescribes a recognition threshold and a measurement attribute for the financial statement recognition and measurement of tax positions taken or expected to be taken in a tax return. For those benefits to be recognized, a tax position must be more-likely-than-not to be sustained upon examination by taxing authorities. There were penalties and related interest of $80 for the fiscal year ended November 30, 2015, and $54 for penalties and interest for the fiscal year to date ended November 30, 2014. Penalties are recorded in selling, general and administrative expenses.
The charitable contributions and net operating loss portion of the deferred tax asset has $9,293,157 that has been reclassified as a long-term asset, based on an estimate of the amount that will be realizable in periods greater than twelve months from November 30, 2015.
At November 30, 2015 and November 30, 2014, respectively, the Company had temporary differences arising from the following:
CCA INDUSTRIES, INC. AND SUBSIDIARIES
NOTES TO UNAUDITED CONSOLIDATED FINANCIAL STATEMENTS
|
| | | | | | | | | | | | | | | | |
| | November 30, 2015 |
| | | | | | Classified As |
Type | | Amount | | Deferred Tax | | Short-Term
Asset | | Long-Term
Asset |
Depreciation | | $ | (250,811 | ) |
| $ | (92,558 | ) |
| $ | — |
|
| $ | (92,558 | ) |
Reserve for bad debts | | 4,911 |
|
| 1,812 |
|
| 1,812 |
|
| — |
|
Reserve for returns | | 907,777 |
|
| 335,003 |
|
| 335,003 |
|
| — |
|
Accrued returns | | 407,992 |
|
| 150,564 |
|
| 150,564 |
|
| — |
|
Reserve for obsolete inventory | | 821,259 |
|
| 303,075 |
|
| 303,075 |
|
| — |
|
Vacation accrual | | 35,955 |
|
| 13,269 |
|
| 13,269 |
|
| — |
|
Bonus obligations unpaid | | 24,000 |
|
| 8,857 |
|
| 8,857 |
|
| — |
|
Restructuring costs | | 1,264,218 |
| | 466,544 |
| | 466,544 |
| | — |
|
Charitable contributions | | 734,643 |
|
| 271,109 |
|
| 86,402 |
|
| 184,707 |
|
Section 263A costs | | 67,129 |
|
| 24,773 |
|
| 24,773 |
|
| — |
|
Loss carry forward | | 27,022,986 |
|
| 9,972,473 |
|
| 864,023 |
|
| 9,108,450 |
|
Net deferred tax asset | | | | $ | 11,454,921 |
| | $ | 2,254,322 |
| | $ | 9,200,599 |
|
| | |
| | November 30, 2014 |
| | | | | | Classified As |
Type | | Amount | | Deferred Tax | | Short-Term
Asset | | Long-Term
(Liability) |
Depreciation | | $ | (1,393,102 | ) | | $ | (252,883 | ) | | $ | — |
| | $ | (252,883 | ) |
Unrealized (gain) on investments | | — |
| | — |
| | — |
| | — |
|
Reserve for bad debts | | 25,124 |
| | 9,272 |
| | 9,272 |
| | — |
|
Reserve for returns | | 2,942,544 |
| | 1,085,907 |
| | 1,085,907 |
| | — |
|
Reserve for obsolete inventory | | 608,504 |
| | 224,560 |
| | 224,560 |
| | — |
|
Vacation accrual | | 148,751 |
| | 54,895 |
| | 54,895 |
| | — |
|
Charitable contributions | | 1,100,940 |
| | 406,287 |
| | 132,853 |
| | 273,434 |
|
Section 263A costs | | 128,079 |
| | 47,266 |
| | 47,266 |
| | — |
|
Loss carry forward | | 22,933,333 |
| | 8,296,176 |
| | 1,328,532 |
| | 6,967,644 |
|
Net deferred tax asset | | | | $ | 9,871,480 |
| | $ | 2,883,285 |
| | $ | 6,988,195 |
|
The amounts recognized in the deferred tax asset are management's best estimate of the amount more likely than not to be realized and the actual results could differ from those estimates. In determining the amount more likely than not to be realized, management considered available information and determined the negative objective evidence, primarily recent losses offset by positive objective evidence, including the effects of current year restructuring expenses that will not recur, the savings of the related payroll and rent expense resulting from the restructuring and forecasts for future profitability. Future profitability in this competitive industry depends on the successful execution of management's initiatives designed to obtain sales levels and improve operating results. The inability to successfully execute these initiatives could reduce estimates of future profitability, which could affect the Company's ability to realize the deferred tax assets.
CCA INDUSTRIES, INC. AND SUBSIDIARIES
NOTES TO UNAUDITED CONSOLIDATED FINANCIAL STATEMENTS
Income tax(benefit) expense is made up of the following components:
|
| | | | | | | | | |
| | November 30, |
Continuing Operations | | 2015 | | 2014 | | 2013 |
Current tax - Federal | | — |
| | — |
| | — |
|
Current tax - State & Local | | (2,795 | ) | | 33,664 |
| | 93,270 |
|
Deferred tax (benefit) | | (1,589,514 | ) | | (1,740,876 | ) | | (2,122,811 | ) |
| | (1,592,309 | ) | | (1,707,212 | ) | | (2,029,541 | ) |
|
| | | | | | | | | |
| | November 30, |
Discontinued Operations | | 2015 | | 2014 | | 2013 |
Current tax - Federal | | — |
| | — |
| | — |
|
Current tax - State & Local | | — |
| | — |
| | — |
|
Deferred tax (benefit) expense | | 6,073 |
| | (3,651,431 | ) | | (1,550,193 | ) |
| | 6,073 |
| | (3,651,431 | ) | | (1,550,193 | ) |
Prepaid and refundable income taxes are made up of the following components:
|
| | | | | | | | | | | | |
Prepaid and refundable income taxes | | Federal | | State &
Local | | Total |
November 30, 2015 | | $ | — |
| | $ | 70,056 |
| | $ | 70,056 |
|
November 30, 2014 | | $ | 167,075 |
| | $ | 286,523 |
| | $ | 453,598 |
|
A reconciliation of the (benefit from) provision for income taxes computed at the statutory rate to the effective rate for the three years ended November 30, 2015, 2014 and 2013 is as follows:
|
| | | | | | | | | | | | | | | | | | | | | |
| | | | | | | | | | | | |
| | 2015 | | 2014 | | 2013 |
| | Amount | | Percent of Pretax Income | | Amount | | Percent of Pretax Income | | Amount | | Percent of Pretax Income |
Continuing Operations | | | | | | | | | | | | |
(Benefit from) income taxes at federal statutory rate | | $ | (1,648,640 | ) | | 34.00 | % | | $ | (1,533,618 | ) | | 34.00 | % | | $ | (1,883,880 | ) | | 34.00 | % |
Changes in (benefit from) income taxes resulting from: | | | | | | | | | | | | |
State income taxes, net of federal income tax benefit | | (140,619 | ) | | 2.90 | % | | (130,809 | ) | | 2.90 | % | | (688,724 | ) | | 12.43 | % |
Non-deductible expenses and other adjustments | | 196,950 |
| | (4.06 | )% | | (42,785 | ) | | 0.95 | % | | 543,063 |
| | (9.80 | )% |
(Benefit from) income taxes at effective rate | | $ | (1,592,309 | ) | | 32.84 | % | | $ | (1,707,212 | ) | | 37.85 | % | | $ | (2,029,541 | ) | | 36.63 | % |
CCA INDUSTRIES, INC. AND SUBSIDIARIES
NOTES TO UNAUDITED CONSOLIDATED FINANCIAL STATEMENTS
|
| | | | | | | | | | | | | | | | | | | | | |
Discontinued Operations | | | | | | | | | | | | |
Provision for (benefit from) income taxes at federal statutory rate | | $ | 6,288 |
| | 34.00 | % | | $ | (3,280,140 | ) | | 34.00 | % | | $ | (1,438,934 | ) | | 34.00 | % |
Changes in provision for (benefit from) income taxes resulting from: | | | | | | | | | | | | |
State income taxes, net of federal income tax benefit | | 536 |
| | 2.90 | % | | (279,777 | ) | | 2.90 | % | | $ | (526,057 | ) | | 12.43 | % |
Non-deductible expenses and other adjustments | | (751 | ) | | (4.06 | )% | | (91,514 | ) | | 0.95 | % | | 414,798 |
| | (9.80 | )% |
Provision for (benefit from) income taxes at effective rate | | $ | 6,073 |
| | 32.84 | % | | $ | (3,651,431 | ) | | 37.85 | % | | $ | (1,550,193 | ) | | 36.63 | % |
NOTE 11 - COMMITMENTS AND CONTINGENCIES
Leases
In April 2015, the Company moved from its facility at 200 Murray Hill Parkway, East Rutherford, New Jersey to a new facility at 65 Challenger Road, Suite 340, Ridgefield Park, New Jersey. The East Rutherford facility consisted of warehouses and offices totaling approximately 81,000 square feet of space. As a result of the outsourcing to the Emerson Group, the Company had not been using the warehouse space since December 2014. The facility at Ridgefield Park is located in an office building and consists of 7,414 square feet of office and allocated common space with an annual rental cost of $159,401 per year. The lease provides for annual rent increases. In addition, the Company will pay an electric charge of $1.75 per square foot per year. The lease is for five years and four months, commencing April 10, 2015, and contains a provision for four months of rent at no charge. In June 2015, the Company sub-let the East Rutherford facility. The terms of the sublet is for a monthly rent of $36,963 plus all common charges and utilities for a term of six years and ten and a half months, expiring in May 2022. The sub-lease provides for annual increases of 2% per year. The Company was leasing the East Rutherford facility for $41,931 per month, with annual increases equal to the change in the consumer price index. The Company recorded an expense of $407,094 during fiscal 2015 as a restructuring charge as an estimate for the difference between the rent that the Company pays its landlord and the rent received from the sub-tenant over the term of the sub-lease.
In addition, the Company has entered into various property and equipment operating leases with expiration dates ranging through March 2019.
CCA INDUSTRIES, INC. AND SUBSIDIARIES
NOTES TO UNAUDITED CONSOLIDATED FINANCIAL STATEMENTS
Future commitments, sub-lease rental income and net commitments under non-cancelable operating lease agreements for each of the next five (5) years and in the aggregate for the years 2020 and thereafter are as follows:
|
| | | | | | |
YEAR ENDING NOVEMBER 30, | Commitments | Sub-lease rental income | Net Commitments |
2016 | 906,981 |
| 653,562 |
| 253,419 |
|
2017 | 869,869 |
| 662,514 |
| 207,355 |
|
2018 | 870,868 |
| 671,646 |
| 199,222 |
|
2019 | 887,858 |
| 680,960 |
| 206,898 |
|
2020 and thereafter | 1,898,218 |
| 1,743,338 |
| 154,880 |
|
Royalty Agreements
In 1986, the Company entered into a license agreement with Alleghany Pharmacal Corporation (the “Alleghany Pharmacal License”). The license agreement, which is for the exclusive rights to Nutra Nail, Hair Off, Properm and IPR-3 was amended in 2011. The Company no longer markets products under the Properm and IPR-3 brand names. The Alleghany Pharmacal License agreement, as amended, requires the Company to pay a royalty rate of 2.5% on net sales of said licensed products with a minimum royalty of $250,000 per annum. The license agreement continues in perpetuity so long as the minimum royalty is paid each year. The Company incurred the minimum royalty of $250,000 as the royalty earned was $78,308 for Alleghany Pharmacal for the fiscal year ended November 30, 2015.
CCA commenced the marketing of its sun-care products line following a May 1998 License Agreement with Solar Sense, Inc. (the “Solar Sense License”), pursuant to which it acquired the exclusive right to use the trademark names “Solar Sense” and “Kids Sense” and the exclusive right to market mark-associated products. The Solar Sense License requires the Company to pay a royalty of 5% on net sales of said licensed products until $2 million total royalties are paid, at which time the royalty rate will be reduced to 1% for a period of twenty-five years. The Company incurred royalties of $44,563 for Solar Sense, Inc. for the fiscal year ended November 30, 2015. Since the contract inception through November 30, 2015, the Company has paid a total of $895,746 in royalties to Solar Sense, Inc.
Effective November 3, 2008, the Company entered into an agreement with Continental Quest Corp., to purchase certain United States trademarks and inventory relating to the Pain Bust*R II business for $285,106 paid at closing. In addition, the Company agreed to pay a royalty equal to 2% of net sales of all Pain Bust*R II products, which are topical analgesics, until an aggregate royalty of $1,250,000 is paid, at which time the royalty payments will cease. The Company incurred royalties of $2,924 to Continental Quest Corp. for the fiscal year ended November 30, 2015. Since the contract inception through November 30, 2015, the Company has paid a total of $75,151 in royalties to Continental Quest Corp.
On March 22, 2002, the Company entered into an agreement with Joann Bradvica, granting the Company an exclusive license to manufacture and sell an Earlobe Patch Support for Earrings. The agreement provided for a royalty of 10% of net sales of the licensed product. A new agreement was entered into and effective on June 8, 2009 at the same royalty rate, and provides for a minimum royalty of $40,000 for annual periods beginning July 1, 2009, in order to maintain the license. The royalty agreement terminated upon the expiration of the licensor's patent on April 15, 2015. The Company incurred royalties of $25,320 to Joann Bradvica for the fiscal year ended November 30, 2015.
The Company is not a party to any other license agreement that is currently material to its operations.
Consulting and Separation Agreements
The Company had executed Employment Contracts with David Edell, its former Chief Executive Officer and Ira Berman, former Corporate Secretary (the “Executives”). Employment under the contracts expired on December 31, 2010. Upon expiration of the employment term on December 31, 2010, the Executives became consultants to the Company for an ensuing five year term in accordance with the provisions of the agreement. On September 5, 2014, the Company entered into Separation Agreements with the Executives whereby they are no longer required to perform
CCA INDUSTRIES, INC. AND SUBSIDIARIES
NOTES TO UNAUDITED CONSOLIDATED FINANCIAL STATEMENTS
any consulting services pursuant to their Amended and Restated Employment Agreements. The Company made an aggregate payment of $1,000,000 to the Executives on the separation date and is required to make an additional aggregate payment of $200,000 to the Executives, which is now payable October 1, 2016 and pay an aggregate of $794,620 in fifteen equal monthly installments of $52,975 commencing on October 3, 2014. The agreement was amended as of August 2015 to reduce the equal monthly payments to an aggregate of $25,000 per month, with the final payment due July 2016.
Employment Agreements
On March 21, 2011, the compensation committee of the board of directors, acting on behalf of the Company, entered into an Employment Agreement (each, an “Employment Agreement”) with each of Stephen A. Heit and Drew Edell (each, an “Executive”). Pursuant to their respective Employment Agreements, Mr. Heit has been engaged to continue to serve as the Company’s Executive Vice President and Chief Financial Officer, and Mr. Drew Edell was engaged to serve as the Company’s Executive Vice President, Product Development and Production. The Company chose to not renew Drew Edell's employment contract with the Company effective November 30, 2014 and recorded a severance charge of $1,001,875, of which $735,000 is due to be paid in fiscal 2016..
Mr. Drew Edell is the son of David Edell, who was a member of the Board of Directors of the Company and had been serving as a consultant to the Company.
The term of employment under Mr. Heit's Employment Agreement runs from March 21, 2011 through December 31, 2013, and has been continued thereafter for successive one-year periods unless the Company or the Executive chooses not to renew the respective Employment Agreement.
Under the Employment Agreement, the base salary of Mr. Heit is $250,000 per annum, and may be increased each year at the discretion of the Company’s Board of Directors. Mr. Heit's base salary was increased to $280,000, effective October 1, 2014. Mr. Heit is eligible to receive an annual performance-based bonus under his Employment Agreement, and entitled to participate in Company equity compensation plans. In addition, Mr. Heit receives an automobile allowance, health insurance and certain other benefits.
In the event of termination of the Employment Agreement as a result of the disability or death of the Executive, the Executive (or his estate or beneficiaries) shall be entitled to receive all base salary and other benefits earned and accrued until such termination as well as a single-sum payment equal to the Executive’s base salary and a single-sum payment equal to the value of the highest bonus earned by the Executive in the one-year period preceding the date of termination pro-rated for the number of days served in that fiscal year.
If the Company terminates the Executive for Cause (as defined in the respective Employment Agreement), or the Executive terminates his employment in a manner not considered to be for Good Reason (as defined in the respective Employment Agreement), the Executive shall be entitled to receive all base salary and other benefits earned and accrued prior to the date of termination. If the Company terminates the Executive in a manner that is not for Cause or due to the Executive’s death or disability, the Executive terminates his employment for Good Reason, or the Company does not renew the Employment Agreement after December 31, 2013, the Executive shall be entitled to receive a single-sum payment equal to his unpaid base salary and other benefits earned and accrued prior to the date of termination and a single-sum payment of an amount equal to three times (a) the average of the annual base salary amounts paid to Executive over the three calendar years prior to the date of termination, (b) if less than three years have elapsed between March 21, 2011 and the date of termination, the highest base salary paid to the Executive in any calendar year prior to the date of termination, or (c) if less than twelve months have elapsed between March 21, 2011 and the date of termination, the highest base salary received in any month times twelve. In addition, each Executive is entitled to the same benefits if the Executive terminates his employment with the Company in connection with a Change of Control (as defined in their respective Employment Agreements).
Under the Employment Agreements, the Executive has agreed to non-competition restrictions for a period of six months following the end of the term of his Employment Agreement, during which period the Executive will be paid an amount equal to his base salary for a period of six months, and an amount equal to the pro rata share of any
CCA INDUSTRIES, INC. AND SUBSIDIARIES
NOTES TO UNAUDITED CONSOLIDATED FINANCIAL STATEMENTS
bonus attributable to the portion of the year completed prior to the date of termination. The Executive has also agreed to confidentiality and non-solicitation restrictions under the Employment Agreements.
The foregoing summary of the Employment Agreements are qualified in their entirety by the full text of the Employment Agreement,a copy of which may be found in Form 8-K that was filed by Company on March 21, 2011 with the United States Securities and Exchange Commission.
The Company also entered into an Employment Agreement with another Company executive, who is not a “named executive officer” within the meaning of the Securities Exchange Act of 1934, as amended and related regulations. The additional Employment Agreement referred to in the preceding sentence contains substantially similar terms as the Employment Agreement discussed above, except that the employee’s base salary is currently $140,000 per annum.
Dividends and Capital Transactions
On March 7, 2013, the Board of Directors of the Company approved a $0.07 per share dividend for the first quarter ending February 28, 2013, payable to all shareholders of record as of March 19, 2013 and was paid on April 19, 2013.
On July 18, 2013, the Board of Directors of the Company approved a $0.07 per share dividend for the second quarter ending May 31, 2013, payable to all shareholders of record as of August 2, 2013 and was paid on September 3, 2013.
On September 5, 2014, the Company entered into a Loan and Security Agreement (the “Agreement”) with Capital Preservation Solutions, LLC (“Capital”) for a $5,000,000 working capital line of credit and a term loan for working capital purposes not to exceed $1,000,000. Capital Preservation Solutions, LLC is owned by Lance Funston, who also is the managing partner of Capital Preservations Holdings, LLC which owns common stock and all of the Company's Class A common stock. Contemporaneously with the signing of the Agreement, the Company issued a Warrant to Purchase Common Stock (the “Warrant”) to Capital whereby Capital may acquire upon exercise of the Warrant 1,892,744 shares of the Company’s Common Stock. The Warrant may be exercised in whole or in part at any time during the exercise period which is five years from the date of the Warrant. The Warrant bears a purchase price of $3.17 per share, subject to adjustments. The working capital line of credit and term loan have been recorded on the consolidated balance sheet as of November 30, 2015 and 2014 as from a related party. Interest and amortized financing costs in the amount of $1,735,967 and $314,213, respectively, was incurred to Capital and is recorded on the consolidated statement of operations for the years ended November 30, 2015 and 2014 as interest expense from a related party.
NOTE 12 - CONCENTRATION OF RISK
Most of the Company’s products are sold to major drug and food chains merchandisers, and wholesale beauty-aids distributors throughout the United States and Canada.
During the fiscal years ended November 30, 2015, 2014 and 2013, certain customers each accounted for more than 5% of the Company’s net sales, as follows:
CCA INDUSTRIES, INC. AND SUBSIDIARIES
NOTES TO UNAUDITED CONSOLIDATED FINANCIAL STATEMENTS
NOTE 12 - CONCENTRATION OF RISK (continued)
|
| | | | | | | | | |
| | For the Year Ended November 30, |
Customer | | 2015 | | 2014 | | 2013 |
Walmart | | 34.6 | % | | 47.0 | % | | 43.0 | % |
Walgreens | | 13.4 | % | | 6.5 | % | | 13.0 | % |
Target | | 7.2 | % | | * |
| | * |
|
CVS | | 5.7 | % | | * |
| | * |
|
Foreign Sales | | 13.2 | % | | 13.6 | % | | 5.0 | % |
The loss of any one of these customers could have a material adverse effect on the Company’s earnings and financial position.
During the fiscal years November 30, 2015, 2014 and 2013, certain products within the Company’s product lines accounted for more than 10% of the Company’s net sales as follows:
|
| | | | | | | | | |
| | For the Year Ended November 30, |
Category | | 2015 | | 2014 | | 2013 |
Skin Care | | 51.9 | % | | 45.9 | % | | 44.8 | % |
Oral Care | | 34.4 | % | | 32.9 | % | | 35.3 | % |
Nail Care | | * |
| | 13.8 | % | | 14.0 | % |
* - under 10% | | | | | | |
NOTE 13 - RESTRUCTURING
The Company commenced a restructuring plan to reduce expenses and make operations more efficient during fiscal 2014. As part of the plan, the Company reduced its work force from 37 to 20 employees during fiscal 2015. The Company has planned for additional personnel to leave during fiscal 2016. The restructuring plan is expected to be complete by the end of the third quarter of fiscal 2016. The restructuring charge of $2,289,406 during fiscal 2015 consisted of severance payment to employees and facility exit costs. The Company incurred facility exit costs of $1,276,477 as a result of exiting and subsequently sub-letting the Company's prior facility at 200 Murray Hill Parkway, East Rutherford, New Jersey. The exit costs included writing off leasehold improvements of $714,138, real estate commissions paid for the sub-lease of $155,245 and a charge of $407,094 as an estimate for the difference between the rent that the Company pays its East Rutherford landlord per the master lease and the rent received from the sub-tenant over the term of the sub-lease. At the end of fiscal 2015, unpaid restructuring costs of $1,676,781, which are due to be paid in fiscal 2016 and fiscal 2017, was recorded as an accrued expense on the Company's consolidated balance sheet, of which $1,256,781 was recorded as a current accrued liability and $420,000 was recorded as a long term accrued liability.
CCA INDUSTRIES, INC. AND SUBSIDIARIES
NOTES TO CONSOLIDATED FINANCIAL STATEMENTS
NOTE 14 - DISCONTINUED OPERATIONS
The Company discontinued the Gel Perfect color nail polish business effective as of May 31, 2014. The Gel Perfect brand had declining sales in fiscal 2013 and 2014 prior to the Company determining to discontinue the brand. Net sales for the years ending November 30, 2015, 2014 and 2013 were $17,979, ($3,065,452) and $10,026,224, respectively. In addition, the Company has increased the total reserve for returns to $3,089,294 as of November 30, 2014 based on the liability with its retail customers for potential returns or mark down agreements. The expense as a result of recording the reserve for returns is reflected as a reduction of net sales for fiscal 2014. As of November 30, 2015, the specific reserve for returns had been fully utilized.
During the third quarter of fiscal 2014 the Company discontinued its operations of the Mega-T brand of weight loss and dietary supplement business and on August 26, 2014, the Company entered into an asset purchase agreement (“Asset Purchase Agreement”) with Mega-T, LLC (“LLC”), an entity formed by Casla Partners Capital Fund I, LP for the sale of inventory, trademarks and other intellectual property rights related to the Mega-T brand. Under the Asset Purchase Agreement, the Company sold its inventory consisting of finished goods, work-in-process, raw materials and packaging supplies, as well as the related trademarks, domain names and goodwill of the Mega-T brand with a total value of $2,053,934 to LLC. In consideration of the sale, LLC assumed all of the liabilities related to returns, co-operative advertising and contract markdowns that occurred prior to the transaction date but have not yet been deducted by the retailers up to a maximum liability of $2,250,000. As of November 30, 2015, the Company does not believe that the maximum liability cap of $2,250,000 will be exceeded. LLC also assumed liabilities for all outstanding purchase orders as long as it receives the inventory from the vendors and any obligations that arise subsequent to the transaction date that related to LLC’s operations of the Mega-T business. The Company is responsible for paying the vendors for any inventory received by the Company prior to the transaction date. The Company decided to sell the Mega-T brand in order to focus its resources behinds its five remaining core brands. The following table summarizes those components of the statement of operations for discontinued brands for the twelve months ended November 30, 2015, 2014 and 2013
:
|
| | | | | | | | | |
| Twelve Months Ended November 30, |
| 2015 |
| Mega | GP | Total |
Net Sales | $ | — |
| $ | 17,979 |
| $ | 17,979 |
|
Income before Provision for Income Taxes | — |
| 18,494 |
| 18,494 |
|
Provision for Income Tax | — |
| 6,073 |
| 6,073 |
|
Net Income | $ | — |
| $ | 12,421 |
| $ | 12,421 |
|
Loss per Share: | | | |
Basic | $ | — |
| $ | — |
| $ | — |
|
Diluted | $ | — |
| $ | — |
| $ | — |
|
Weighted average shares outstanding | | |
Basic | 7,006,684 |
| 7,006,684 |
| 7,006,684 |
|
Diluted | 7,006,684 |
| 7,006,684 |
| 7,006,684 |
|
CCA INDUSTRIES, INC. AND SUBSIDIARIES
NOTES TO CONSOLIDATED FINANCIAL STATEMENTS
|
| | | | | | | | | |
| | | |
| | | |
| Twelve Months Ended November 30, |
| | 2014 | |
| Mega | GP | Total |
Net Sales | $ | 291,652 |
| $ | (3,357,104 | ) | $ | (3,065,452 | ) |
Income (loss) before Provision for (Benefit from) Income Taxes | (3,454,184 | ) | (6,193,288 | ) | $ | (9,647,472 | ) |
Provision for (Benefit from) Income Tax | (1,307,360 | ) | (2,344,071 | ) | $ | (3,651,431 | ) |
Net Income (Loss) | $ | (2,146,824 | ) | $ | (3,849,217 | ) | $ | (5,996,041 | ) |
Earnings (loss) per Share: | | | |
Basic | $ | (0.31 | ) | $ | (0.55 | ) | $ | (0.86 | ) |
Diluted | $ | (0.31 | ) | $ | (0.55 | ) | $ | (0.86 | ) |
Weighted average shares outstanding | | | |
Basic | 7,006,684 |
| 7,006,684 |
| 7,006,684 |
|
Diluted | 7,006,684 |
| 7,006,684 |
| 7,006,684 |
|
|
| | | | | | | | | |
| Twelve Months Ended November 30, |
| | 2013 | |
| Mega | GP | Total |
Net Sales | $ | 6,610,539 |
| $ | 3,415,685 |
| $ | 10,026,224 |
|
Income before Provision for Income Taxes | 579,812 |
| (4,811,971 | ) | (4,232,159 | ) |
Provision for Income Tax | 212,378 |
| (1,762,571 | ) | (1,550,193 | ) |
Net Income | $ | 367,434 |
| $ | (3,049,400 | ) | $ | (2,681,966 | ) |
Earnings per Share: | | | |
Basic | $ | 0.05 |
| $ | (0.43 | ) | $ | (0.38 | ) |
Diluted | $ | 0.05 |
| $ | (0.43 | ) | $ | (0.38 | ) |
Weighted average shares outstanding | | |
Basic | 7,037,694 |
| 7,037,694 |
| 7,037,694 |
|
Diluted | 7,037,694 |
| 7,037,694 |
| 7,037,694 |
|
NOTE 15 - QUARTERLY RESULTS
The following financial data is a summary of the quarterly results of operations (unaudited) during and for the years ended November 30, 2015 and 2014:
CCA INDUSTRIES, INC. AND SUBSIDIARIES
NOTES TO UNAUDITED CONSOLIDATED FINANCIAL STATEMENTS
|
| | | | | | | | | | | | | | | | | |
| | Three Months Ended | |
Fiscal 2015 | | Feb. 28 | | May 31 | | Aug. 31 | | Nov. 30 | |
Net Sales | | $6,952,857 | | $6,666,621 | | $7,055,399 | | $4,079,073 | |
Total Revenue | | 6,957,516 |
| | 6,670,233 |
| | 7,079,673 |
| | 4,082,133 |
| |
Cost of Sales | | 2,318,485 |
| | 2,920,313 |
| | 2,704,117 |
| | 2,502,454 |
| |
Gross Profit | | 4,634,372 |
| | 3,746,308 |
| | 4,351,282 |
| | 1,576,619 |
| |
Income (Loss) from Continued Operations | | 57,608 |
| | (1,776,992 | ) | | 175,080 |
| | (1,712,328 | ) | |
(Loss) Income from Discontinued Operations | | — |
| | 190,274 |
| | (125,191 | ) | | (52,662 | ) | |
Net (Loss) Income | | 57,608 |
| | (1,586,718 | ) | | 49,889 |
| | (1,764,990 | ) | |
Earnings (Loss) Per Share: | | | | | | | | | |
Basic | | | | | | | | | |
Continuing Operations | | $ | 0.01 |
| | $ | (0.25 | ) | | $ | 0.02 |
| | $ | (0.24 | ) | |
Discontinued Operations | | $ | — |
| | $ | 0.03 |
| | $ | (0.02 | ) | | $ | (0.01 | ) | |
Total (loss) earnings per share | | $ | 0.01 |
| | $ | (0.22 | ) | | $ | — |
| | $ | (0.25 | ) | |
Diluted | | | | | | | | | |
Continuing Operations | | $ | 0.01 |
| | $ | (0.25 | ) | | $ | 0.02 |
| | $ | (0.24 | ) | |
Discontinued Operations | | $ | — |
| | $ | 0.03 |
| | $ | (0.02 | ) | | $ | (0.01 | ) | |
Total (loss) earnings per share | | $ | 0.01 |
| | $ | (0.22 | ) | | $ | — |
| | $ | (0.25 | ) | * |
* - Certain charges relating to the continued restructuring of the Company's business should have been recognized in the second quarter of 2015. The Company subsequently corrected this error and recorded these charges during the fourth quarter of 2015. The impact of this item would have increased net loss by $420,000 in the second quarter of 2015 and correspondingly decreased net loss by $420,000 in the fourth quarter of 2015. The Company's management assessed the impact of such errors on the financial statements and determined that the errors in the second quarter of 2015 and the related correction in the fourth quarter 2015 did not have a material impact on the Company's financial statements for each of those quarters. Therefore, the Company's management determined that no restatement of prior filings is necessary.
|
| | | | | | | | | | | | | | | | |
| | Three Months Ended |
Fiscal 2014 | | Feb. 28 | | May 31 | | Aug. 31 | | Nov. 30 |
Net Sales | | $8,068,006 | | $8,761,946 | | $7,807,019 | | $5,483,328 |
Total Revenue | | 8,304,928 |
| | 8,769,567 |
| | 8,017,261 |
| | 5,486,789 |
|
Cost of Sales | | 1,326,852 |
| | 5,338,683 |
| | 4,069,779 |
| | 2,894,912 |
|
Gross Profit | | 6,741,154 |
| | 3,423,263 |
| | 3,737,240 |
| | 2,588,416 |
|
Income (Loss) from Continued Operations | | 2,750,295 |
| | (1,678,514 | ) | | (199,110 | ) | | (3,676,099 | ) |
(Loss) Income from Discontinued Operations | | (3,838,474 | ) | | (2,458,192 | ) | | 887,221 |
| | (586,596 | ) |
Net (Loss) Income | | (1,088,179 | ) | | (4,136,706 | ) | | 688,111 |
| | (4,262,695 | ) |
Earnings (Loss) Per Share: | | | | | | | | |
Basic | | | | | | | | |
Continuing Operations | | $ | 0.39 |
| | $ | (0.24 | ) | | $ | (0.03 | ) | | $ | (0.52 | ) |
Discontinued Operations | | $ | (0.55 | ) | | $ | (0.35 | ) | | $ | 0.13 |
| | $ | (0.08 | ) |
Total (loss) per share | | $ | (0.16 | ) | | $ | (0.59 | ) | | $ | 0.10 |
| | $ | (0.60 | ) |
Diluted | | | | | | | | |
Continuing Operations | | $ | 0.39 |
| | $ | (0.24 | ) | | $ | (0.03 | ) | | $ | (0.52 | ) |
Discontinued Operations | | $ | (0.55 | ) | | $ | (0.35 | ) | | $ | 0.13 |
| | $ | (0.08 | ) |
Total (loss) per share | | $ | (0.16 | ) | | $ | (0.59 | ) | | $ | 0.10 |
| | $ | (0.60 | ) |
The Company discontinued the Gel Perfect nail polish brand and sold the Mega-T dietary supplement brand, both of which are reported as discontinued operations in the statement of operations for the each of the quarters for the years in fiscal 2015 and 2014.
CCA INDUSTRIES, INC. AND SUBSIDIARIES
NOTES TO CONSOLIDATED FINANCIAL STATEMENTS
NOTE 16 - STOCK-BASED COMPENSATION
On June 15, 2005, the shareholders approved an amended and Restated Stock Option Plan amending the 2003 Stock Option Plan (the “Plan”). The Plan authorizes the issuance of up to one million shares of common stock (subject to customary adjustments set forth in the plan) pursuant to equity awards, which may take the form of incentive stock options, nonqualified stock options restricted shares, stock appreciation rights and/or performance shares. The plan expired in April, 2015. On August 13, 2015, the shareholders approved the 2015 CCA Industries, Inc. Incentive Plan(the "2015 Plan"). The 2015 Plan authorizes the issuance of up to 700,000 shares of common stock (subject to customary adjustments set forth in the plan) pursuant to equity awards, which may take the form of incentive stock options, nonqualified stock options, stock appreciation rights, restricted stock, performance shares and cash awards.
On January 1, 2006, the Company adopted ASC Topic 718, "Stock Compensation" which requires an entity to recognize the grant-date fair value of stock options and other equity-based compensation issued to employees in the financial statements.
The fair value of the stock option grants below were estimated on the date of the grant using a Black-Scholes valuation model and the assumptions in the following table:
|
| | | | |
| Assumptions: |
Option Grant Date | Risk-free Interest Rate | Dividend Yield | Stock Volatility | Option Term (years) |
February 1, 2014 | 1.49% | —% | 32.16% | 5 |
October 2, 2014 | 1.70% | —% | 36.63% | 10 |
October 16, 2014 | 1.70% | —% | 37.51% | 10 |
January 5, 2015 | 1.57% | —% | 37.74% | 10 |
April 9, 2015 | 1.40% | —% | 37.79% | 10 |
On January 5, 2015, the Company granted incentive stock options for 175,000 shares to eight employees of the Company at 3.48 per share. The closing price of the Company's stock on the date of the grant was 3.48 per share. The options vest in equal 20% increments commencing one year after the date of grant, and for each of the four subsequent anniversaries of such date. The options expire on January 5, 2025. The Company had estimated the fair value of the options granted to be $297,833 as of the grant date. Subsequent to the grant date, 130,000 incentive stock option shares were forfeited, which had a fair market value of $221,247 at the time of the grant. The balance of 45,000 shares outstanding from the January 5, 2015 grant with a fair market value of $76,586 is being amortized as an expense over a five year period. Accordingly, the Company recorded a charge against earnings in the amount of $14,041 for the fiscal year end November 30, 2015.
On April 9, 2015, the Company granted incentive stock options for 10,000 shares to an employee of the Company, at $3.18 per share. The closing price of the Company's stock on the date of grant was $3.18 per share. The options vest in equal 20% increments commencing one year after the date of grant, and for each of the four subsequent anniversaries of such date. The options expire on April 8, 2025. The Company has estimated the fair value of the options granted to be $15,418 as of the grant date, which amount shall be amortized as an expense over a five year period. Accordingly, the Company recorded a charge against earnings in the amount of $2,056 for the fiscal year end November 30, 2015.
There were 88,000 incentive stock option shares forfeited in fiscal 2015 that were granted in fiscal 2014. The Company had estimated the fair market value of the forfeited shares to be $108,479 as of the grant date.
CCA INDUSTRIES, INC. AND SUBSIDIARIES
NOTES TO CONSOLIDATED FINANCIAL STATEMENTS
A summary of stock option activity for the Company is as follows:
|
| | | | |
| Number of Options | Weighted-Average Exercise Price | Weighted-Average Remaining Term (years) | Aggregate Intrinsic Value |
Outstanding at November 30, 2013 | — | — | — | — |
Granted | 137,000 | $3.40 | — | |
Exercised | — | — | — | — |
Cancelled or Forfeited | — | — | — | — |
Outstanding at November 30, 2014 | 137,000 | 3.40 | 5.70 | — |
Granted | 185,000 | 3.46 | — | — |
Exercised | — | — | — | — |
Cancelled or Forfeited | 218,000 | 3.45 | — | — |
Outstanding at November 30, 2015 | 104,000 | 3.42 | 7.91 | — |
Deferred compensation expense recognized for the years ended November 30, 2015, 2014 and 2013 was $67,398, $29,035 and $0, respectively.
A summary of the amortization expense of stock options outstanding as of November 30, 2015 is as follows:
|
| | | | |
For the years ended November 30, |
2016 | 2017 | 2018 | 2019 | 2020 |
$18,401 | $18,401 | $18,401 | $18,401 | $2,304 |
The following table summarizes information about currently outstanding and vested stock options at November 30, 2015:
|
| | | |
| | Weighted-Average Remaining Term (years) | |
| Number of Options Granted | Number of Option Shares Vested |
Exercise Price |
$3.40 | 20,000 | 3.17 | 20,000 |
$3.42 | 27,000 | 8.84 | 27,000 |
$3.36 | 2,000 | 8.88 | 2,000 |
$3.48 | 45,000 | 9.10 | — |
$3.18 | 10,000 | 9.36 | — |
Total | 104,000 | | 49,000 |
CCA INDUSTRIES, INC. AND SUBSIDIARIES
NOTES TO CONSOLIDATED FINANCIAL STATEMENTS
NOTE 17 - RELATED PARTY TRANSACTIONS
On September 5, 2014, the Company entered into a Loan and Security Agreement (the “Agreement”) with Capital Preservation Solutions, LLC (“Capital”) for a $5,000,000 working capital line of credit and a term loan for working capital purposes not to exceed $1,000,000. Capital Preservation Solutions, LLC is owned by Lance Funston, who also is the managing partner of Capital Preservations Holdings, LLC which owns common stock and all of the Company's Class A common stock. Contemporaneously with the signing of the Agreement, the Company issued a Warrant to Purchase Common Stock (the “Warrant”) to Capital whereby Capital may acquire upon exercise of the Warrant 1,892,744 shares of the Company’s Common Stock. The Warrant may be exercised in whole or in part at any time during the exercise period which is five years from the date of the Warrant. The Warrant bears a purchase price of $3.17 per share, subject to adjustments. The working capital line of credit and term loan have been recorded on the consolidated balance sheet as of November 30, 2014 as from a related party. Interest and amortized financing costs in the amount of $1,735,967 was incurred to Capital and is recorded on the consolidated statement of operations for the year ended November 30, 2015 as interest expense from a related party. The working capital and term loan under the Agreement was paid in full on December 4, 2015, and the Agreement expired on December 5, 2015.
The Company signed an agreement in December 2014 with Funston Media Management Services, Inc., which is owned by Lance Funston, who is now the Company's Chairman of the Board and Chief Executive Officer. The agreement provided for Funston Media Management Services, Inc. to provide consumer advertising purchasing services and brand management for a fee equal to 7.5% of the advertising costs with a minimum fee of $256,200 for the contract period. The agreement also provided for a monthly management fee of $15,000, which was amended to $5,000 per month for the contract period. The agreement ended on November 19, 2015. The Company incurred costs in the amount of $316,200 for the 2015 fiscal year, of which $136,200 remains unpaid and is recorded as an accrued expense on the consolidated balance sheet as of November 30, 2015.
NOTE 18 - (LOSS) EARNINGS PER SHARE
Basic (loss) earnings per share is calculated using the average number of common shares outstanding. Diluted (loss) earnings per share is computed on the basis of the average number of common shares outstanding plus the effect of outstanding stock options using the “treasury stock method”.
CCA INDUSTRIES, INC. AND SUBSIDIARIES
NOTES TO CONSOLIDATED FINANCIAL STATEMENTS
|
| | | | | | | | | | | | |
| | For the Year Ended November 30, |
| | 2015 | | 2014 | | 2013 |
Net (loss) from continued operations available for common shareholders | | $ | (3,256,632 | ) | | $ | (2,803,428 | ) | | $ | (3,511,282 | ) |
Net income (loss) from discontinued operations available for common shareholders | | $ | 12,421 |
| | $ | (5,996,041 | ) | | $ | (2,681,966 | ) |
Weighted average common shares outstanding-Basic | | 7,006,684 |
| | 7,006,684 |
| | $ | 7,037,694 |
|
Net effect of dilutive stock options and warrant | | — |
| | — |
| | — |
|
Weighted average common shares and common shares equivalents—Diluted | | 7,006,684 |
| | 7,006,684 |
| | 7,037,694 |
|
| | | | | | |
Loss Earning per Share: | | | | | | |
Basic | | | | | | |
Continuing Operations | | $ | (0.46 | ) | | $ | (0.40 | ) | | $ | (0.50 | ) |
Discontinued Operations | | $ | — |
| | $ | (0.86 | ) | | $ | (0.38 | ) |
Total (loss) earnings per share | | $ | (0.46 | ) | | $ | (1.26 | ) | | $ | (0.88 | ) |
| | | | | | |
Diluted | | | | | | |
Continuing Operations | | $ | (0.46 | ) | | $ | (0.40 | ) | | $ | (0.50 | ) |
Discontinued Operations | | $ | — |
| | $ | (0.86 | ) | | $ | (0.38 | ) |
Total (loss) earnings per share | | $ | (0.46 | ) | | $ | (1.26 | ) | | $ | (0.88 | ) |
1,892,744 of shares underlying outstanding warrant and 104,000 shares underlying stock options were excluded for the year ended November 30, 2015 and 1,892,744 of shares underlying outstanding warrant and 137,000 shares underlying stock options were excluded for the year ended November 30, 2014 from the diluted loss per share because the effects of such shares were anti-dilutive. No such share equivalents existed in 2013.
CCA INDUSTRIES, INC. AND SUBSIDIARIES
NOTES TO CONSOLIDATED FINANCIAL STATEMENTS
NOTE 19 - SUBSEQUENT EVENTS
On December 1, 2015, the independent members of the Board of Directors awarded options to purchase 75,000 shares of stock as of December 1, 2015 to four members of the board of directors. The options were granted at $3.16 per share, which was the closing price on December 1, 2015. The options vest one year from the grant date and will expire on November 30, 2020.
On December 4, 2015 (the “Closing Date”), CCA Industries, Inc., a Delaware corporation (the “Company”), entered into the Credit and Security Agreement (the “Credit Agreement”) with SCM Specialty Finance Opportunities Funds, L.P., an affiliate of CNH Finance, L.P. The Credit Agreement provides for a line of credit up to a maximum of $5,500,000 (the “Revolving Loan”). The proceeds of the Revolving Loans was used to pay off the Company's existing debt with Capital Preservation Solutions, LLC and for general working capital purposes.
Pursuant to the Credit Agreement, all outstanding amounts under the Revolving Loan bear interest at the 30 day LIBOR rate plus 6% per annum (currently in the aggregate, 6.21% per annum), payable monthly in arrears. The Company is also required to pay a monthly unused line fee and collateral management fee. The commitment under the Credit Agreement expires three years after the Closing Date. The Revolving Loan and all other amounts due and owing under the Credit Agreement and related documents are secured by a first priority perfected security interest in, and lien on, substantially all of the assets of the Company. Amounts available for borrowing under the Line of Credit equal the lesser of the Borrowing Base (as defined below), and $5,500,000, in each case, as the same is reduced by the aggregate principal amount outstanding under the Line of Credit. “Borrowing Base” under the Loan Agreement means, generally, the amount equal to (i) 85% of the Company’s eligible accounts receivable, plus (ii) 65% of the value of eligible inventory, less (iii) certain reserves. The Credit Agreement contains customary representations, warranties and covenants on the part of the Company, including a financial covenant requiring the Company to maintain a fixed charge coverage ratio of no less than 1.0 to 1.0. The Credit Agreement imposes an early termination fee and also provides for
events of default, including failure to repay principal and interest when due and failure to perform or violation of the provisions or covenants of the agreement.
On the Closing Date, the Company drew $4,100,000 on the Revolving Loan. Of the amount drawn, $3,721,583 was used to pay the principal amount of $3,700,000 and accrued interest of $21,583 due under the Company's Loan Agreement with Capital Preservation Solutions, LLC entered into on September 4, 2015. Capital Preservation Solutions is controlled by Lance T. Funston, the Chairman of the Board of the Company and Chief Executive Officer. The balance of the funds drawn were used to pay certain fees and expenses related to entering into the Credit Agreement, with a balance of $46,032 remitted to the Company.
Effective January 15, 2016, Rick Kornhauser stepped down as Chief Executive Officer and President of the Company as per the Settlement Agreement and General Release with the Company signed on January 21, 2016. Mr. Kornhauser also resigned from the board of directors, as per a letter received by the Company and effective January 21, 2016. Mr. Kornhauser stated in his resignation letter that his resignation was not the result of any disagreements with the Company. Lance T. Funston was appointed Chief Executive Officer of the Company, effective with Mr. Kornhauser's departure, in addition to his responsibilities as Chairman of the Board. Lance T. Funston was elected Chairman of the Board in August 2015. Mr. Funston also serves as Chairman and CEO of Ultimark Products, LLC which he founded in 2000. Mr. Funston will be paid $350,000 per annum as Chief Executive Office of the company. There is no written employment agreement with Mr. Funston. Under the terms of the settlement agreement with Mr. Kornhauser, the Company will pay $280,000 in four payments of $70,000 each to Mr. Kornhauser, with the first payment due no later than January 28, 2016, and subsequent payments every three months until paid in full.
SCHEDULE II
VALUATION ACCOUNTS
Years Ended November 30, 2015, 2014 and 2013: |
| | | | | | | | | | | | |
COL. A | | COL. B | | COL. C | | COL. D | | COL. E |
| | Balance at
Beginning
Of Year | | Additions
Charged To
Costs and
Expenses | | Deductions | | Balance
At End
Of Year |
Description | | | | | | | | |
Year Ended November 30, 2015: | | | | | | | | |
Allowance for cooperative advertising | | 592,202 |
| | 6,704,055 |
| | 6,879,431 |
| | 416,826 |
|
Allowance for doubtful accounts | | 25,124 |
| | 23,536 |
| | 43,749 |
| | 4,911 |
|
Reserve for returns and allowances | | 2,942,543 |
| | 8,927,671 |
| | 10,962,438 |
| | 907,776 |
|
| | 3,559,869 |
| | 15,655,262 |
| | 17,885,618 |
| | 1,329,513 |
|
Accrual for returns included in accrued liabilities | | 653,894 |
| | 407,992 |
| | 653,894 |
| | 407,992 |
|
Accrual for cooperative advertising in accrued liabilities | | 2,368,808 |
| | 1,697,493 |
| | 2,368,808 |
| | 1,697,493 |
|
Reserve for inventory obsolescence | | 992,296 |
| | 952,823 |
| | 1,123,860 |
| | 821,259 |
|
Year Ended November 30, 2014: | | | | | | | | |
Allowance for cooperative advertising | | 1,035,798 |
| | 8,887,840 |
| | 9,331,436 |
| | 592,202 |
|
Allowance for doubtful accounts | | 56,512 |
| | 38,135 |
| | 69,523 |
| | 25,124 |
|
Reserve for returns and allowances | | 1,024,764 |
| | 10,815,137 |
| | 8,897,358 |
| | 2,942,543 |
|
| | 2,117,074 |
| | 19,741,112 |
| | 18,298,317 |
| | 3,559,869 |
|
Accrual for returns included in accrued liabilities | | 1,045,458 |
| | 653,855 |
| | 1,045,419 |
| | 653,894 |
|
Accrual for cooperative advertising in accrued liabilities | | 3,218,259 |
| | 2,368,808 |
| | 3,218,259 |
| | 2,368,808 |
|
Reserve for inventory obsolescence | | 3,030,306 |
| | 2,152,014 |
| | 4,190,024 |
| | 992,296 |
|
Year Ended November 30, 2013: | | | | | | | | |
Allowance for cooperative advertising | | 1,212,067 |
| | 1,862,856 |
| | 2,039,125 |
| | 1,035,798 |
|
Allowance for doubtful accounts | | 26,340 |
| | 55,204 |
| | 25,032 |
| | 56,512 |
|
Reserve for returns and allowances | | 1,107,221 |
| | 6,341,262 |
| | 6,423,719 |
| | 1,024,764 |
|
| | 2,345,628 |
| | 8,259,322 |
| | 8,487,876 |
| | 2,117,074 |
|
Accrual for returns included in accrued liabilities | | 665,185 |
| | 1,045,458 |
| | 665,185 |
| | 1,045,458 |
|
Accrual for cooperative advertising in accrued liabilities | | 2,471,174 |
| | 3,218,259 |
| | 2,471,174 |
| | 3,218,259 |
|
Reserve for inventory obsolescence | | 671,609 |
| | 2,903,499 |
| | 544,802 |
| | 3,030,306 |
|